2.2. Display satellite images(s) in Copernicus Browser
2.2.1. Display satellite images(s) with true colors
By default Copernicus Browser displays a True color image Fig. 2.2.1.1; True color is a combination of Red, Green, and Blue, for Sentinel-2, they can be found in band 4, band 3, and band 2 (further information about Sentinel-2). Thus, Earth’s surface is shown as humans would see it naturally. All the layers come with a description. To expand the window and read it click on (1).
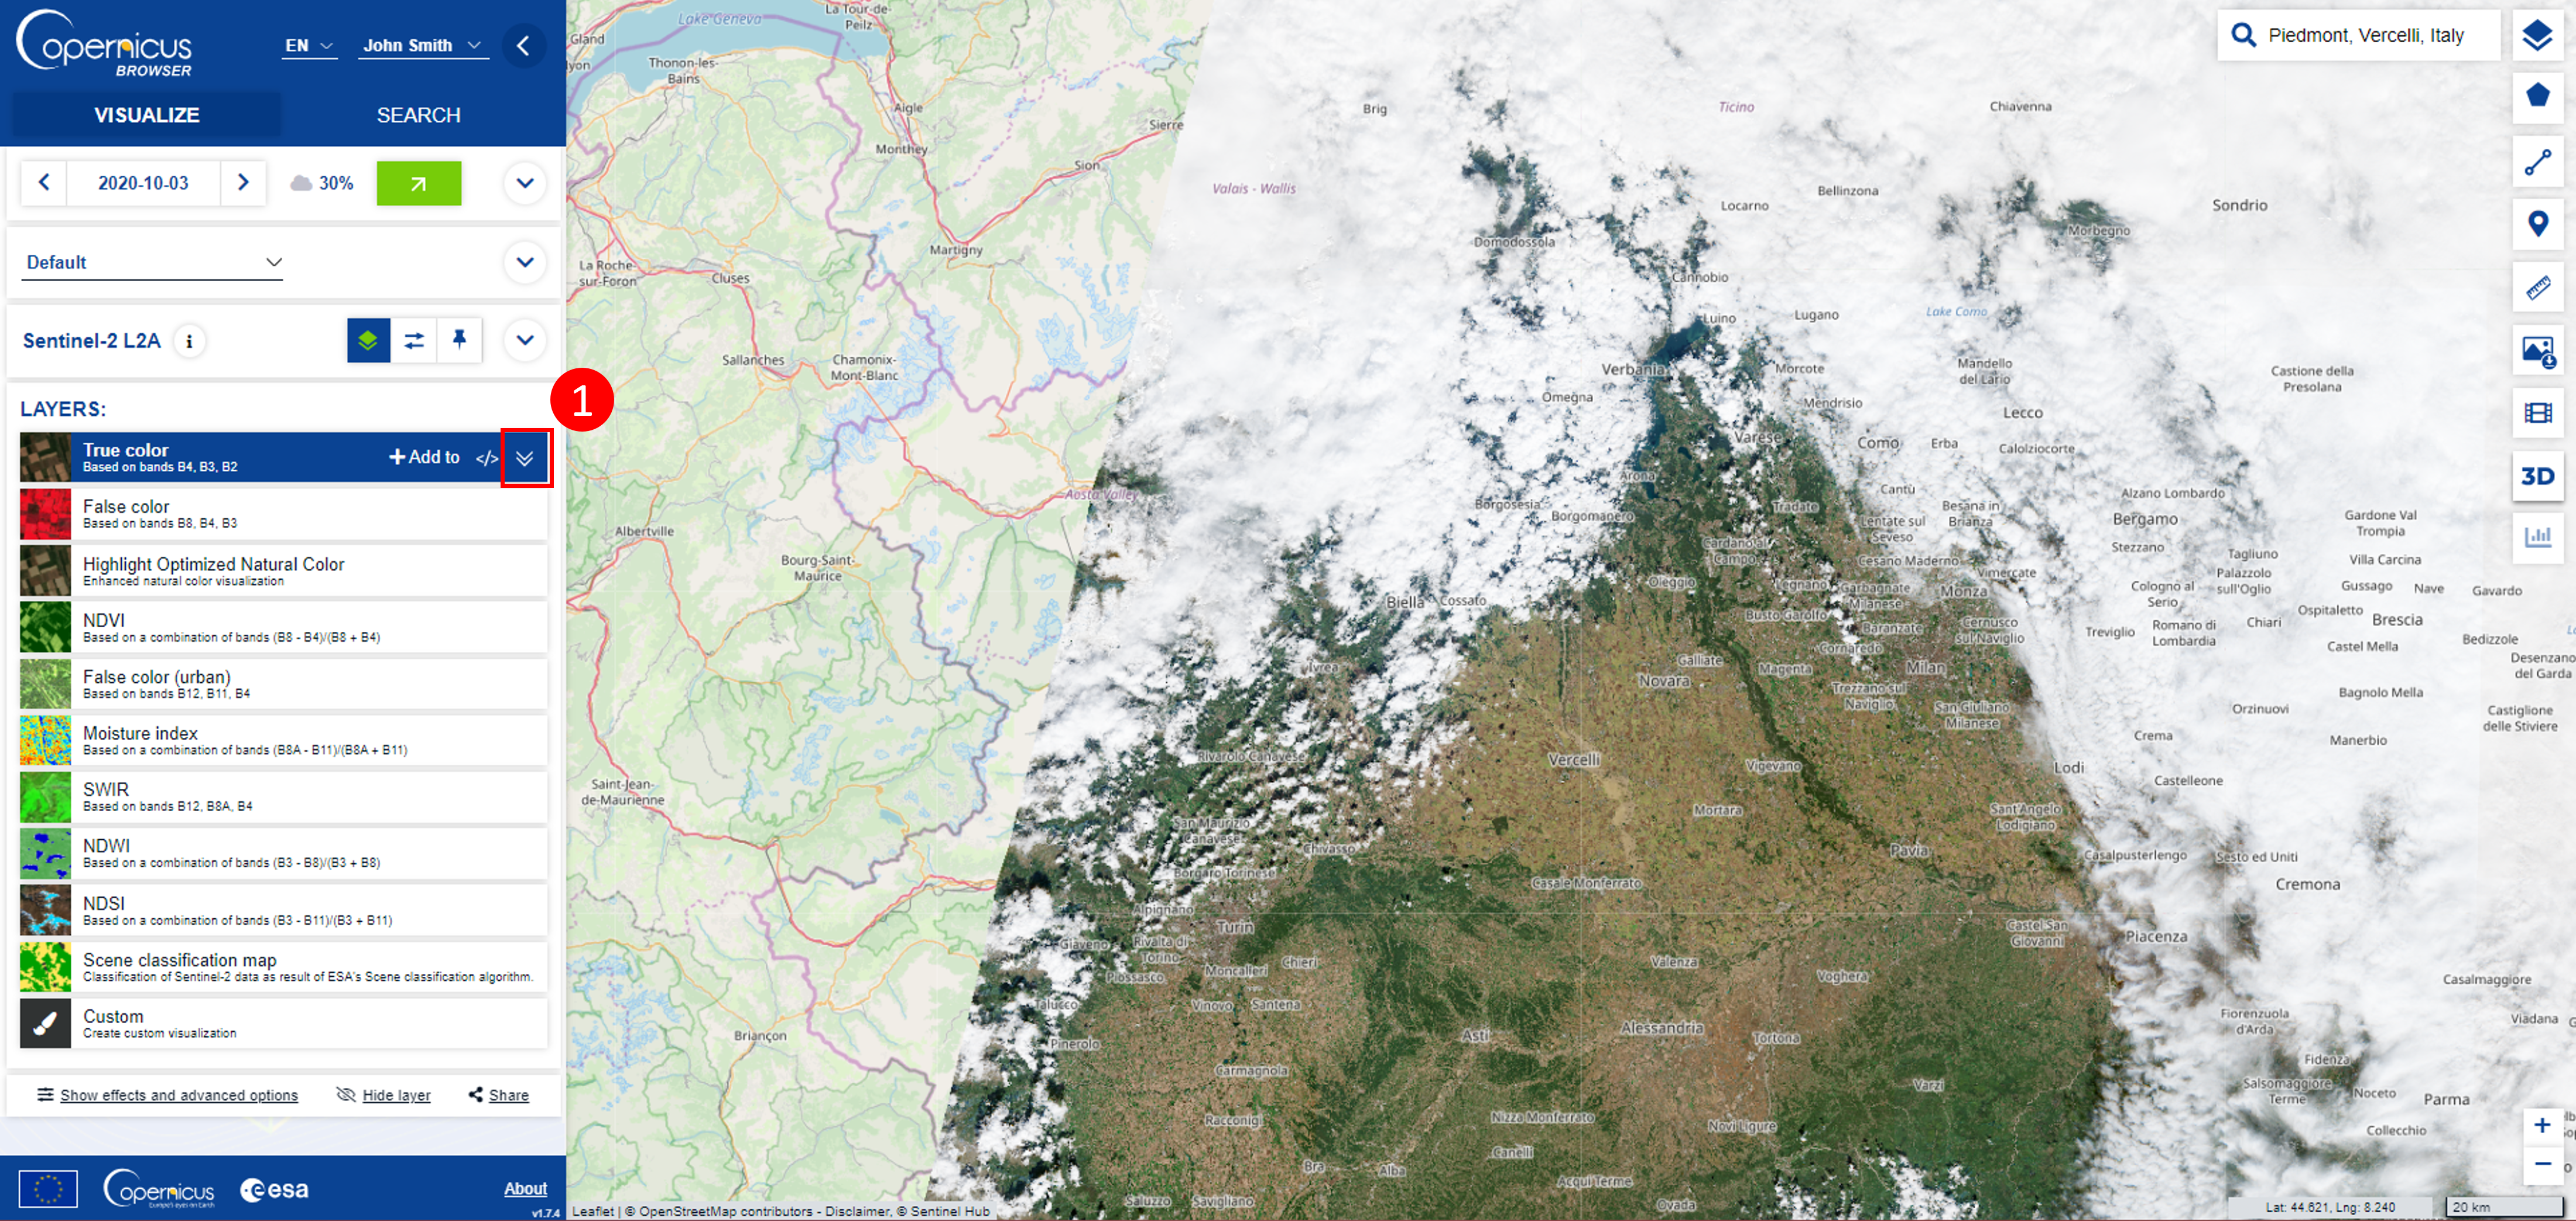
Fig. 2.2.1.1 – Displayed satellite images(s) with true color
2.2.2. Calculate the Normalized Difference Water Index
The Normalized Difference Water Index (NDWI), is used to map water bodies. The index is calculated using a combination of the near infrared (NIR) and Green spectral bands.
2.2.2.1. Integrated Visualization functionality of Copernicus Browser
Combinations of bands that represent layers, are already prepared for you in Copernicus Browser , to switch among them, just click on the desired index. Visualizations by means of indices are listed below True color. To view the NDWI in Copernicus Browser (Fig. 2.2.2.1), click on NDWI in the left panel (1).
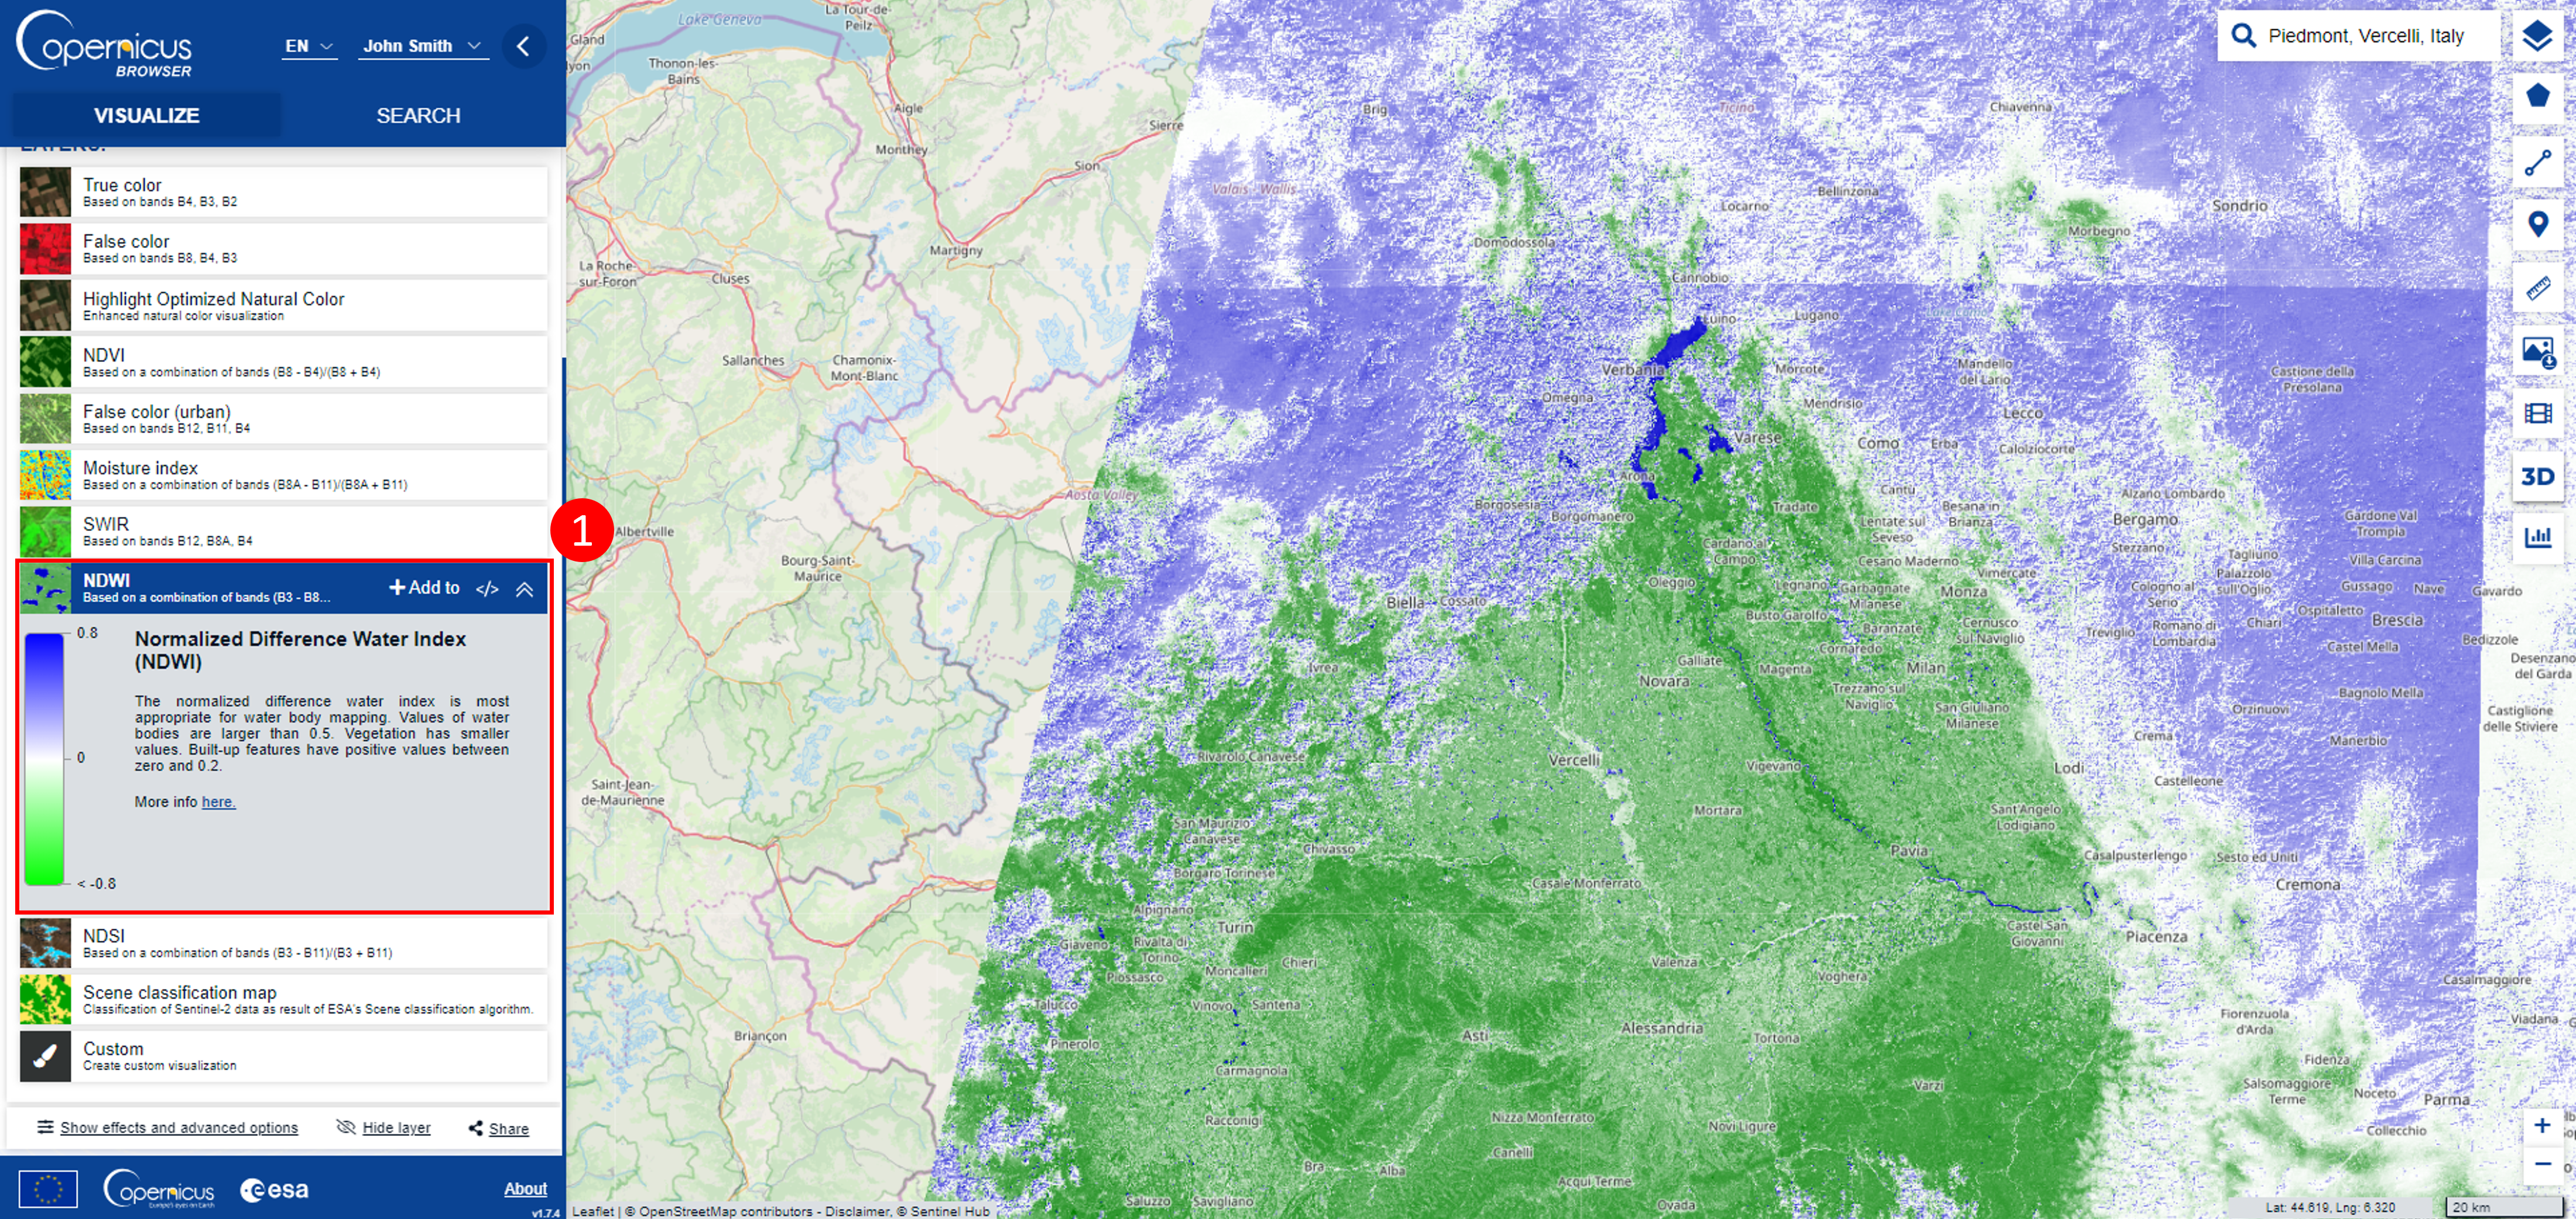
Fig. 2.2.2.1 – NDWI visualization in Copernicus Browser
Zoom in to Vercelli
Use the zoom functionality focusing on “Vercelli” to have an idea where the water bodies are (Fig. 2.2.2.2).
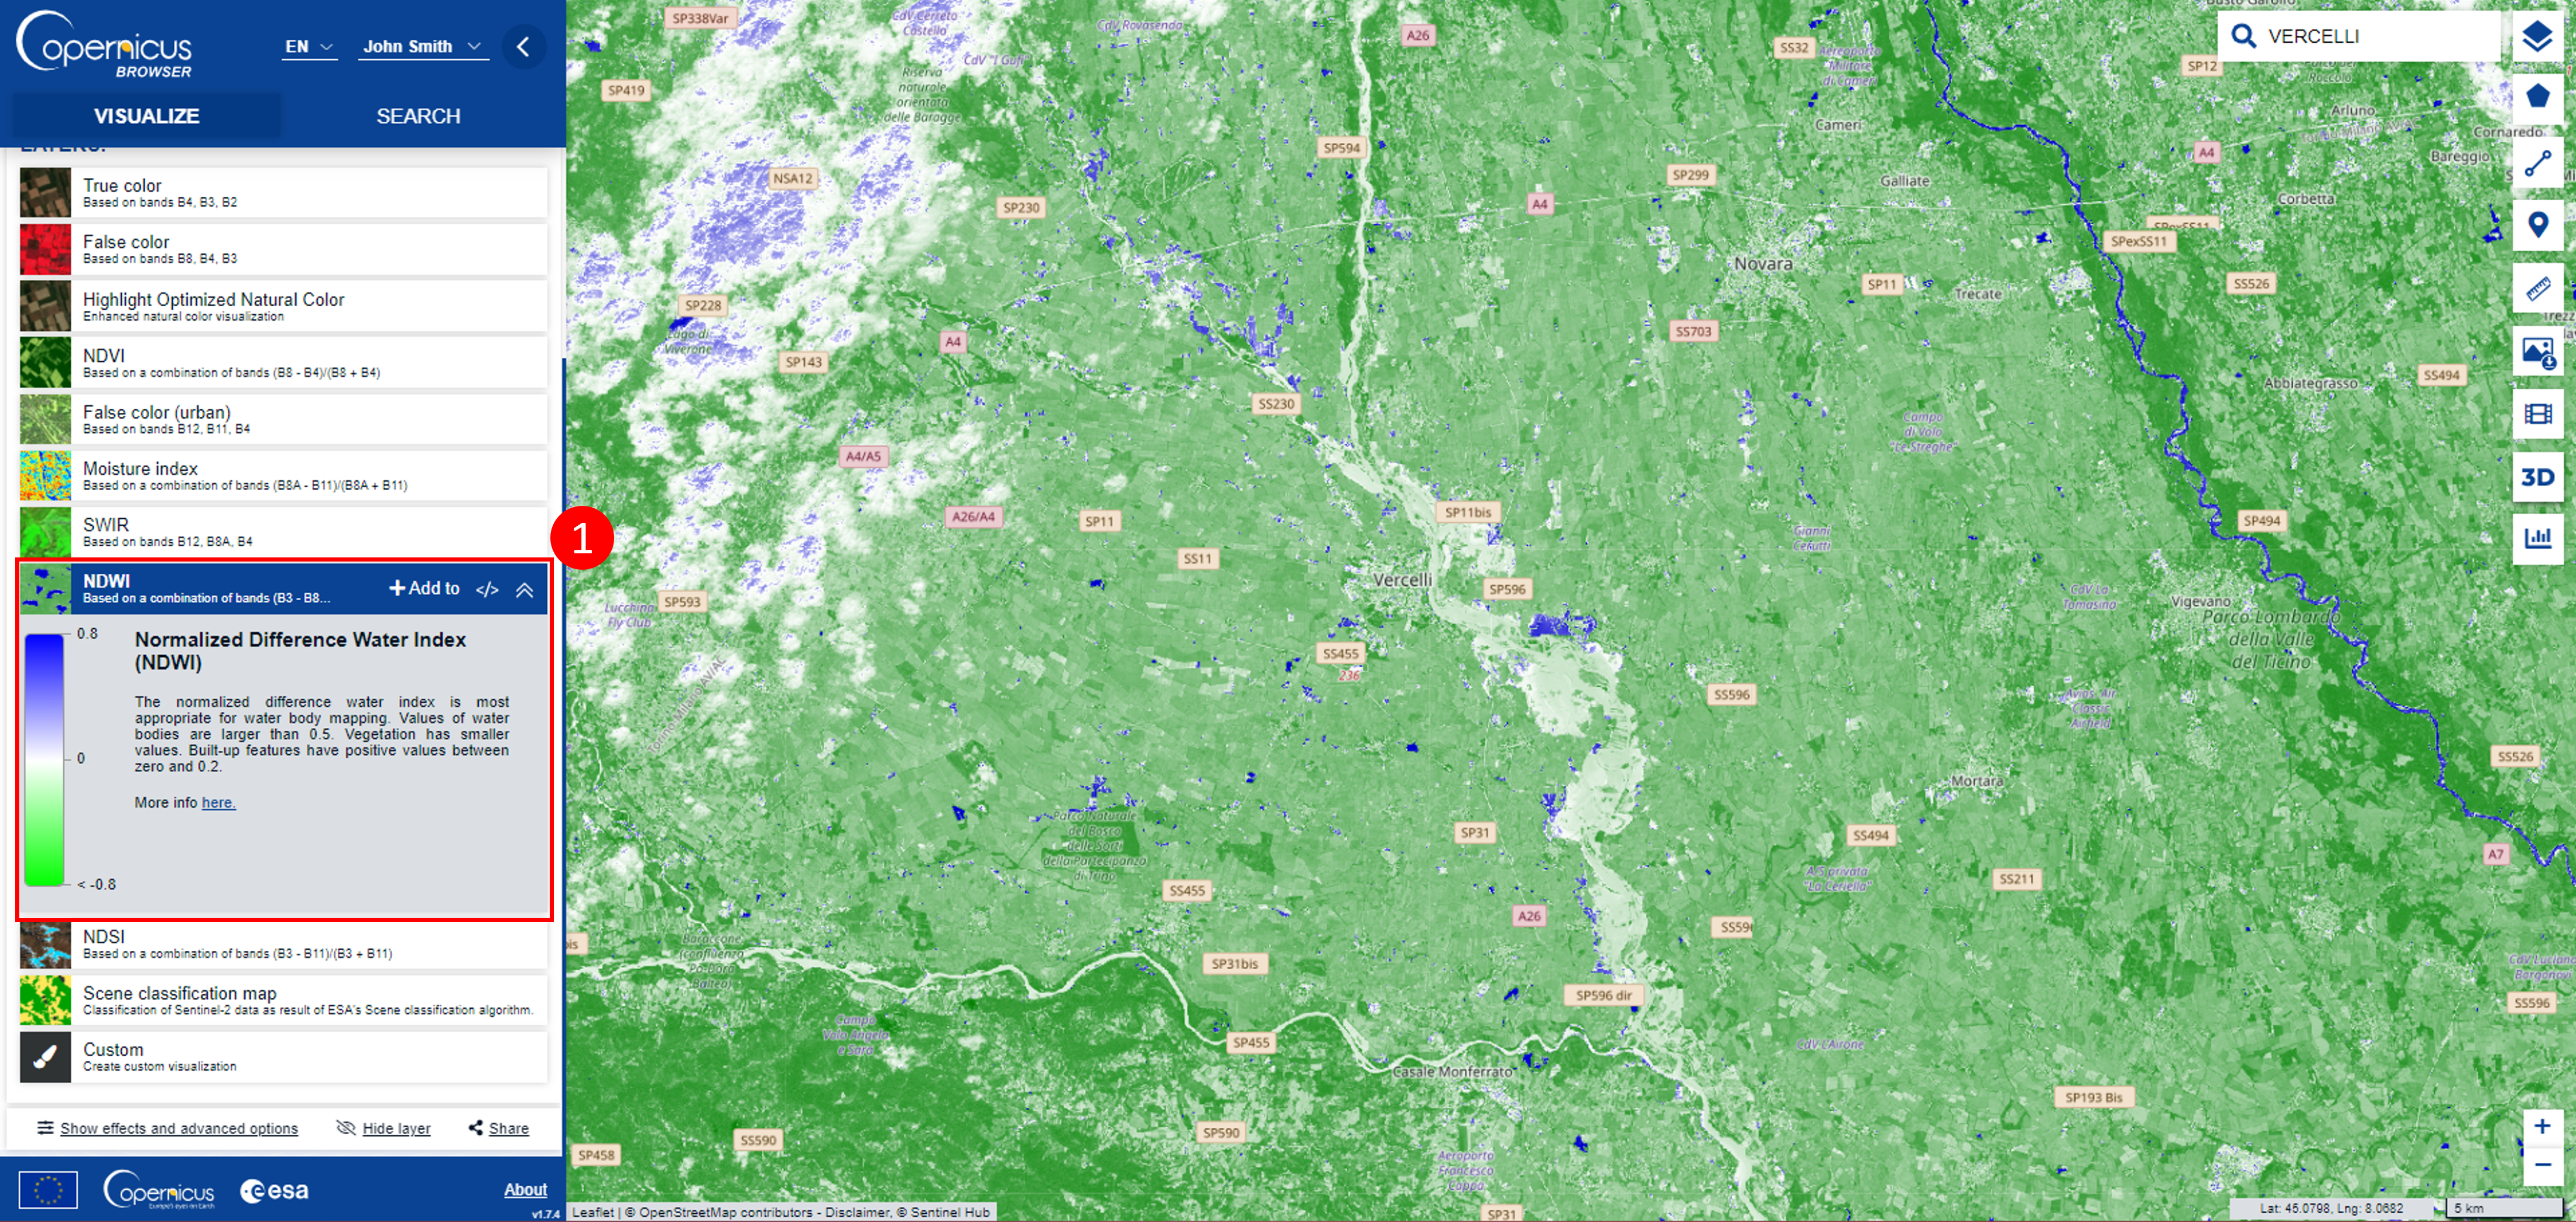
Fig. 2.2.2.2 – Vercelli’s NDWI in Copernicus Browser
Indices in Copernicus Browser come with a legend. This represents the key of understanding the Satellite image. An example of legend relative to the NDWI is reported in Fig. 2.2.2.3.
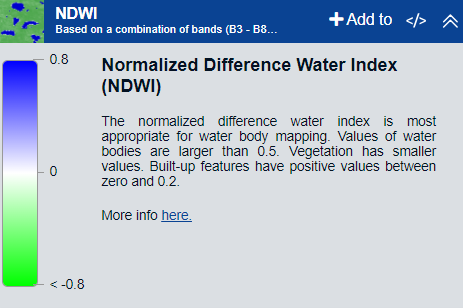
Fig. 2.2.2.3 – NDWI Legend
2.2.2.2. Indices computation functionality of Copernicus Browser
Copernicus Browser offers the possibility to make calculations based on bands, thus the ability to calculate indices yourself by applying equations (Indeces formulas). To obtain the NDWI click on Custom (1). (Fig. 2.2.2.4)
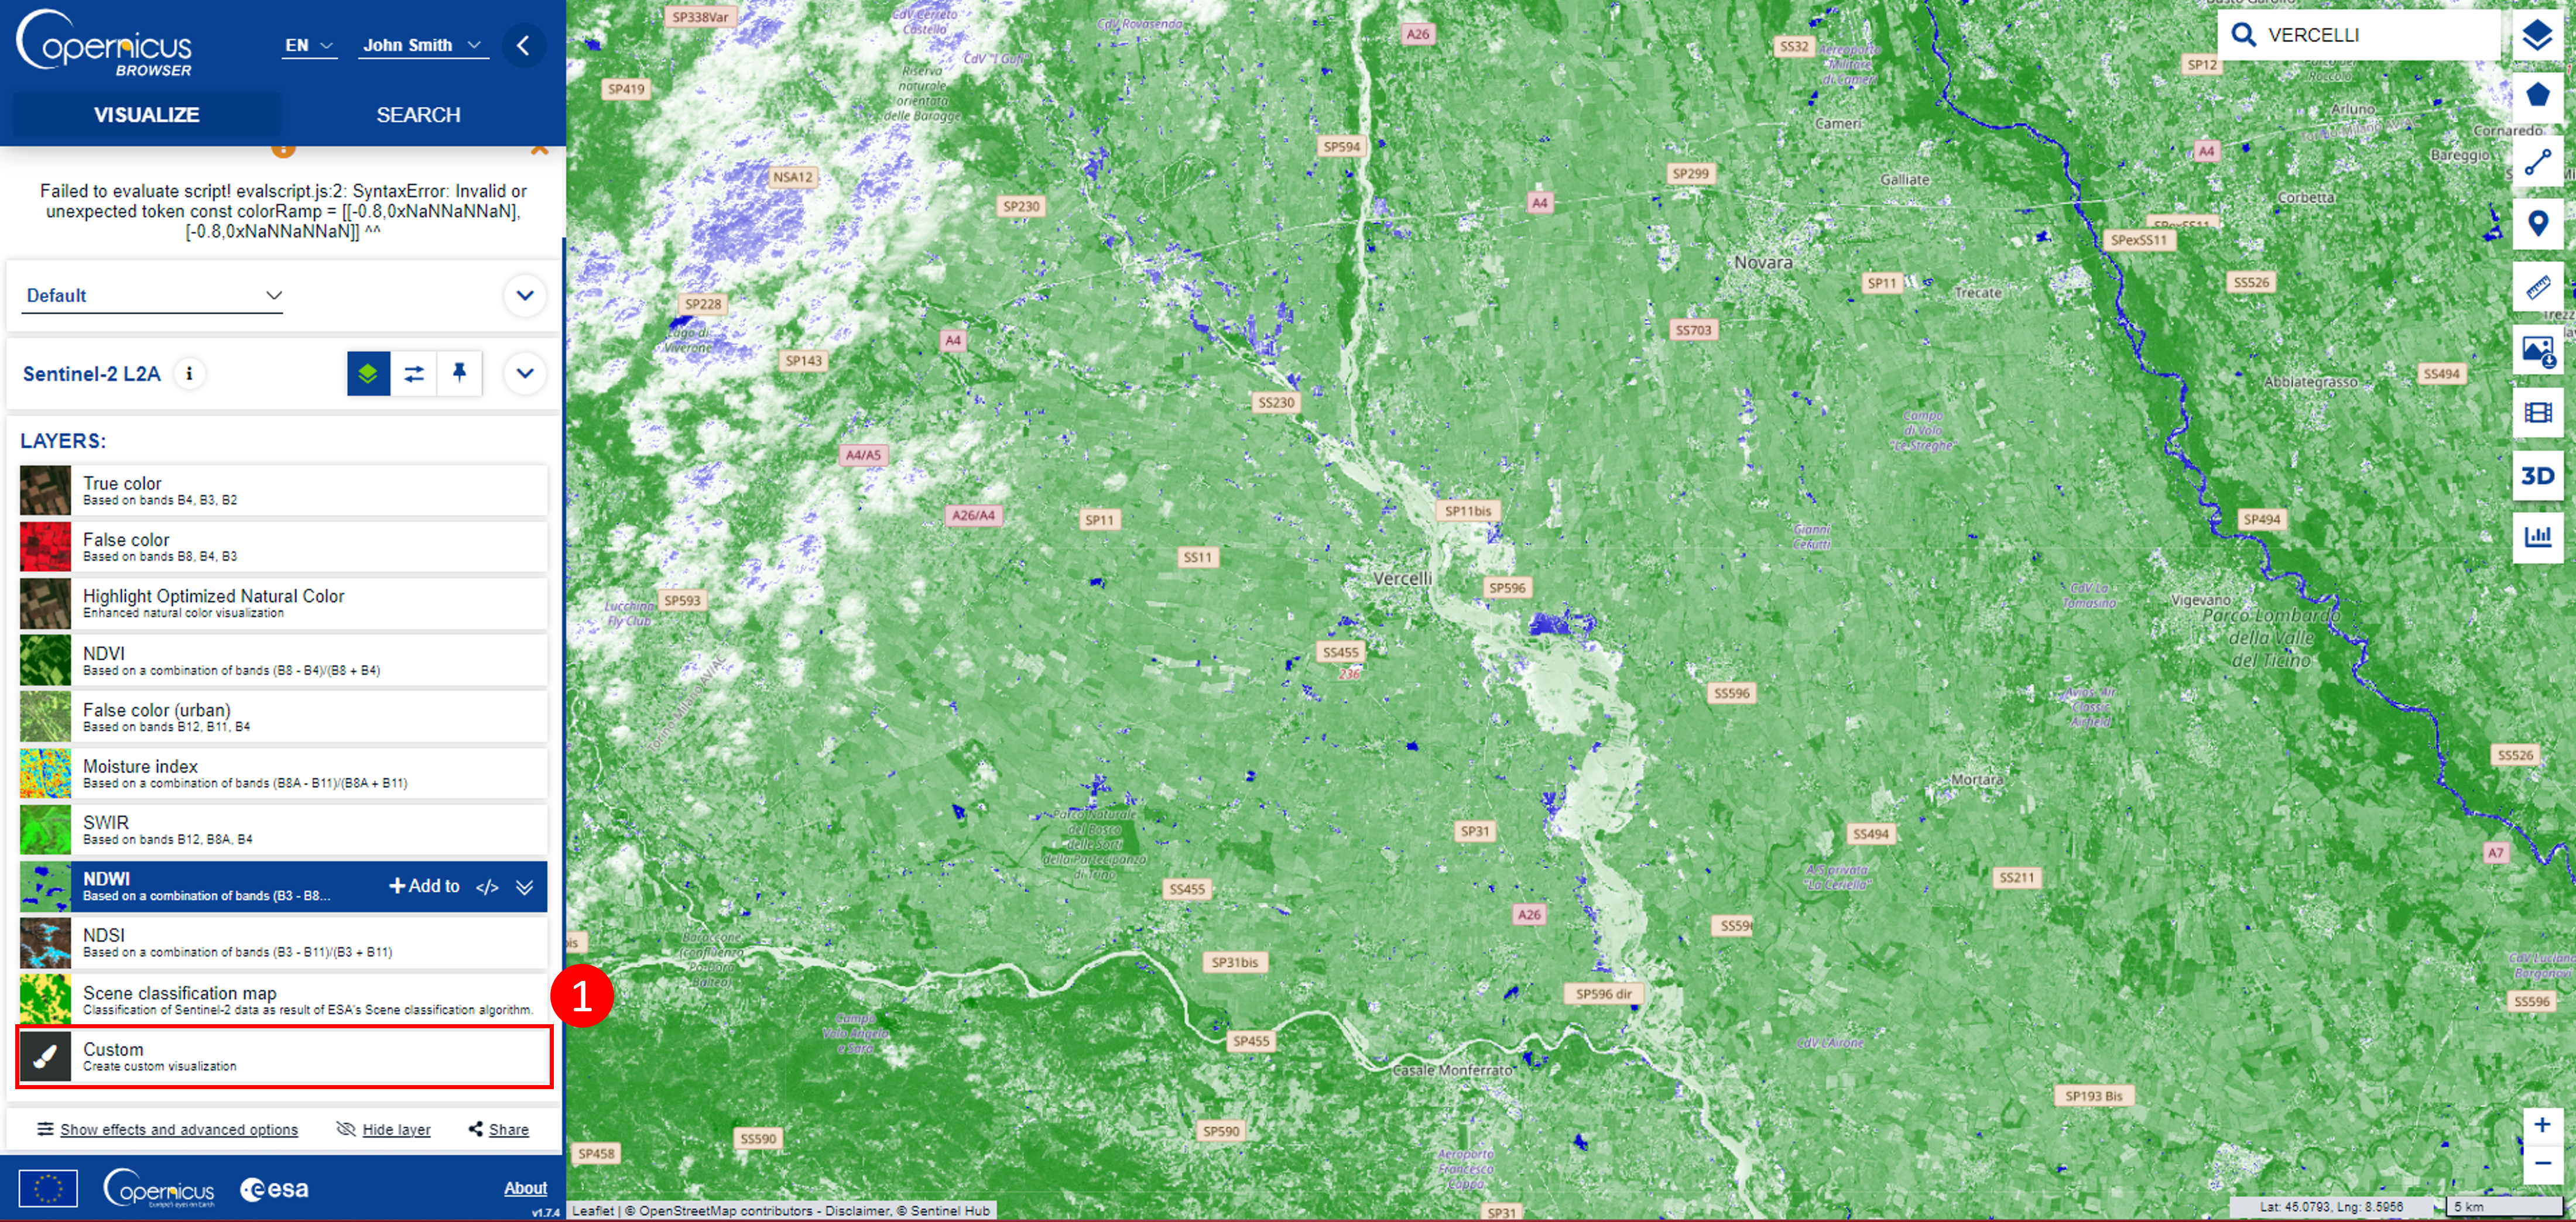
Fig. 2.2.2.4 – Navigate to start NDWI calculation
Now click on Index (1) (Fig. 2.2.2.5) and apply the NDWI equation by dragging the corresponding bands (2) into the equation (3). Finally, change the color scheme by clicking on Threshold (4), which will drop down multiple styles, and choose among them the one you like. We will move now to the next section, click on Back (5).
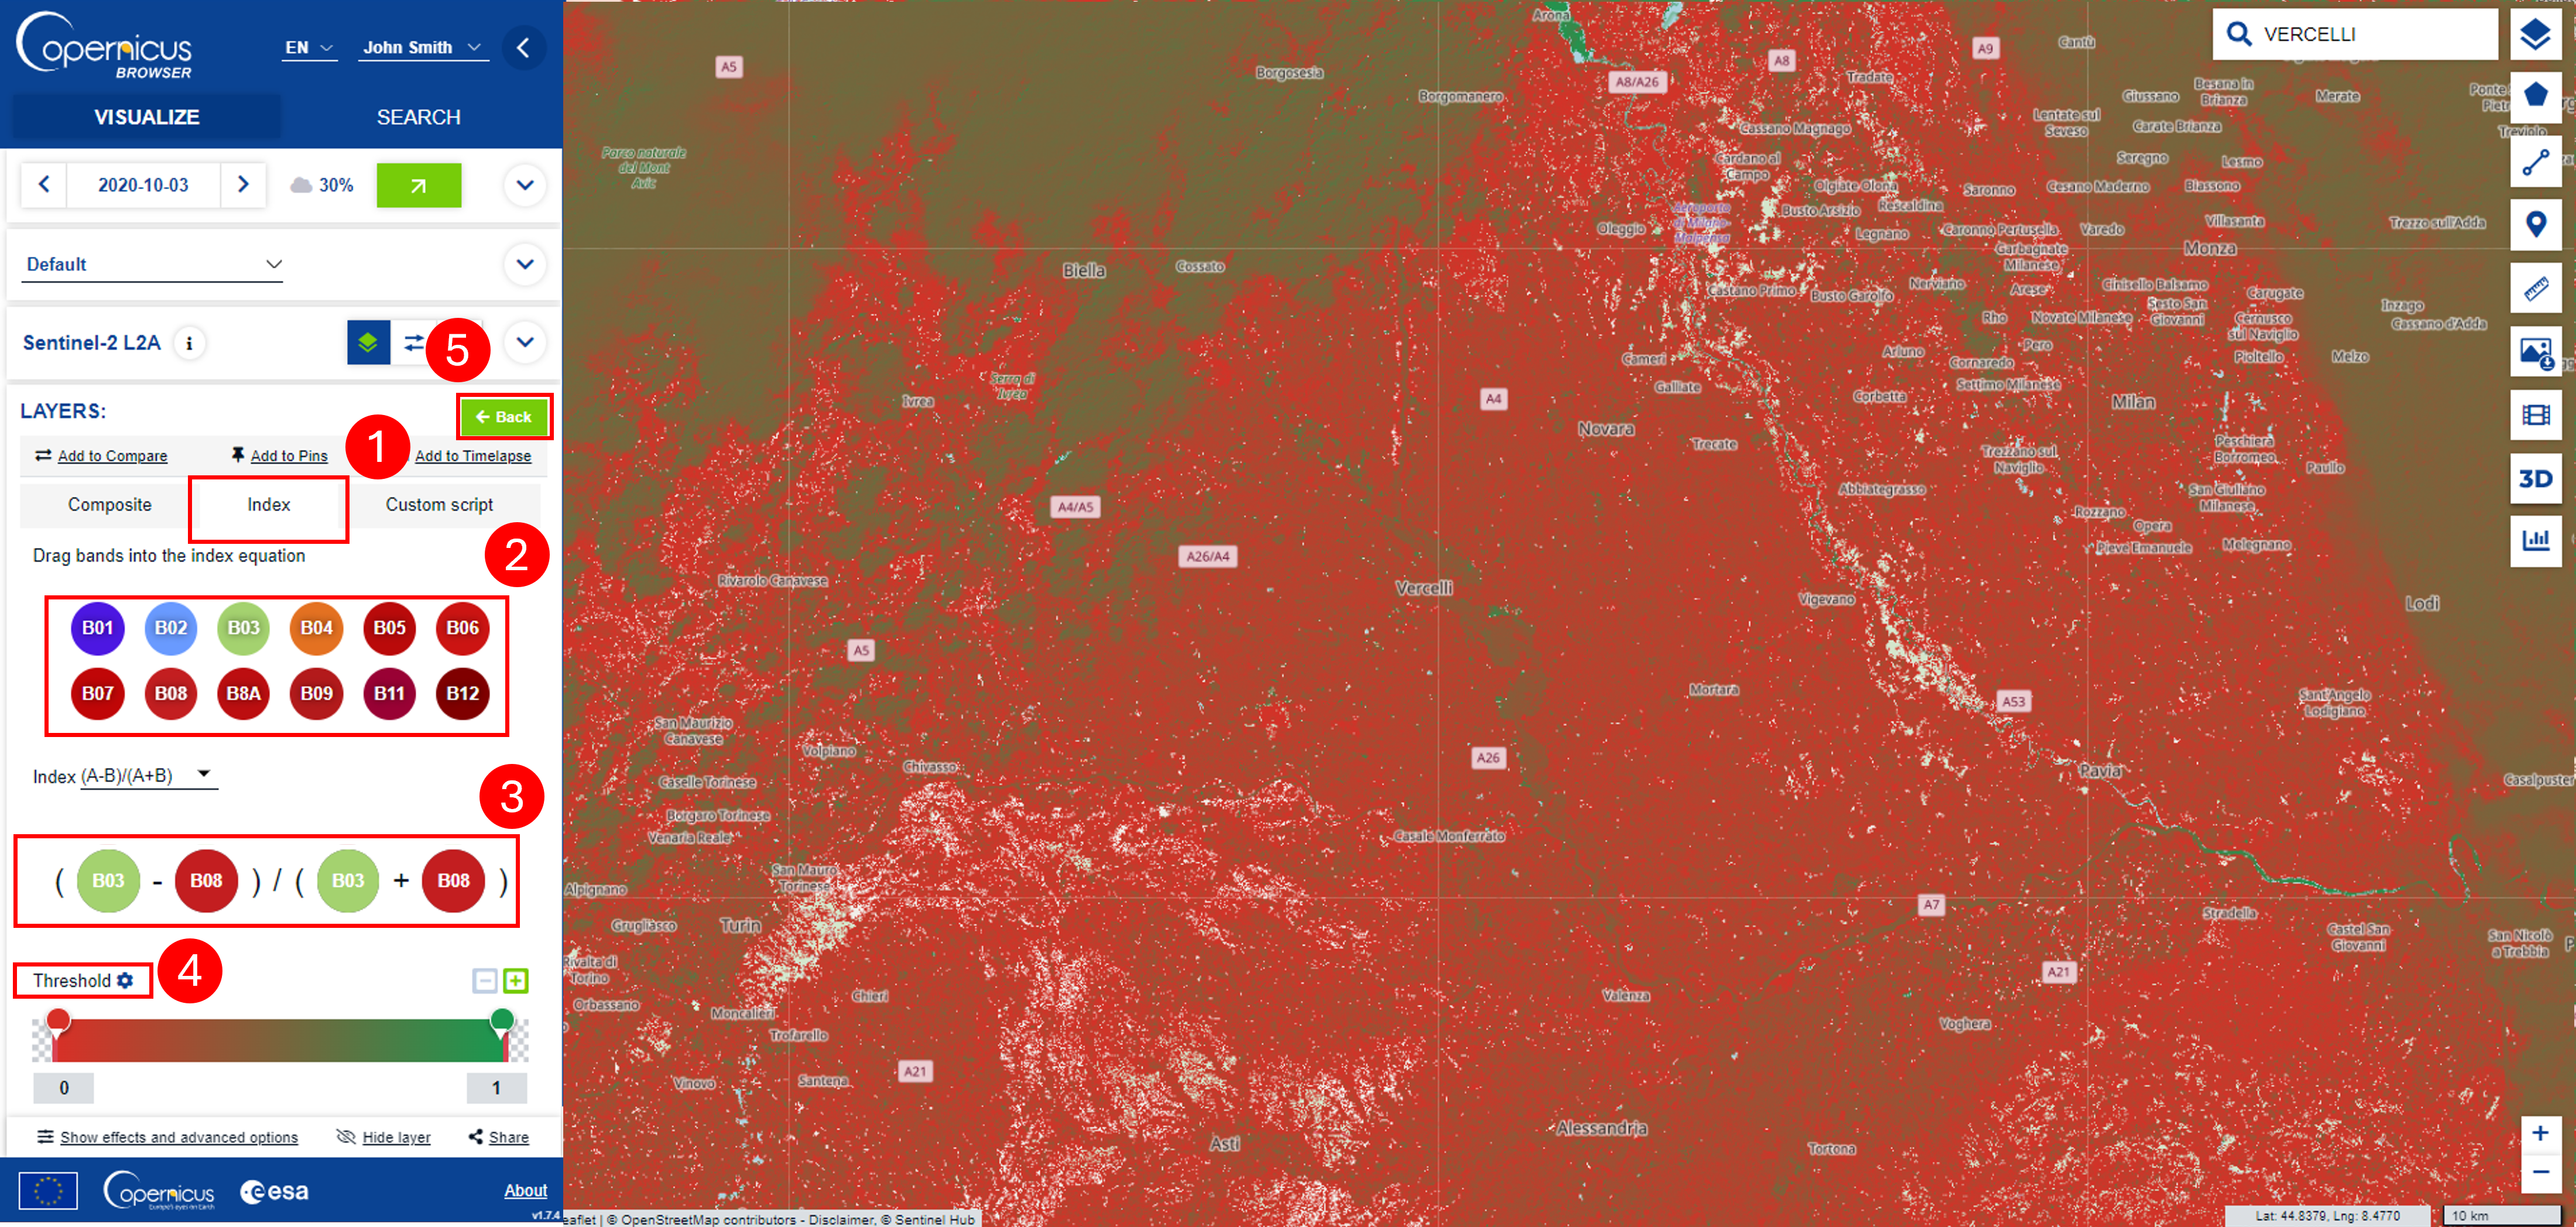
Fig. 2.2.2.5 – NDWI Calculation and visualization
2.2.3. 3D Satellite image visualization in Copernicus Browser
We will now see how to get a 3D visualization of our True Color Layer (Fig. 2.2.3.1), in order to do so click on the 3D icon on the right (1), once you have done it the symbol on the icon will change and will allow you to go back to a 2D visualization. Move yourself in the 3D space using the pan console (2) and the camera console (3). Click on setting (4) and increase the Vertical terrain scaling (5) in order to make more visible the difference in height of the terrain.
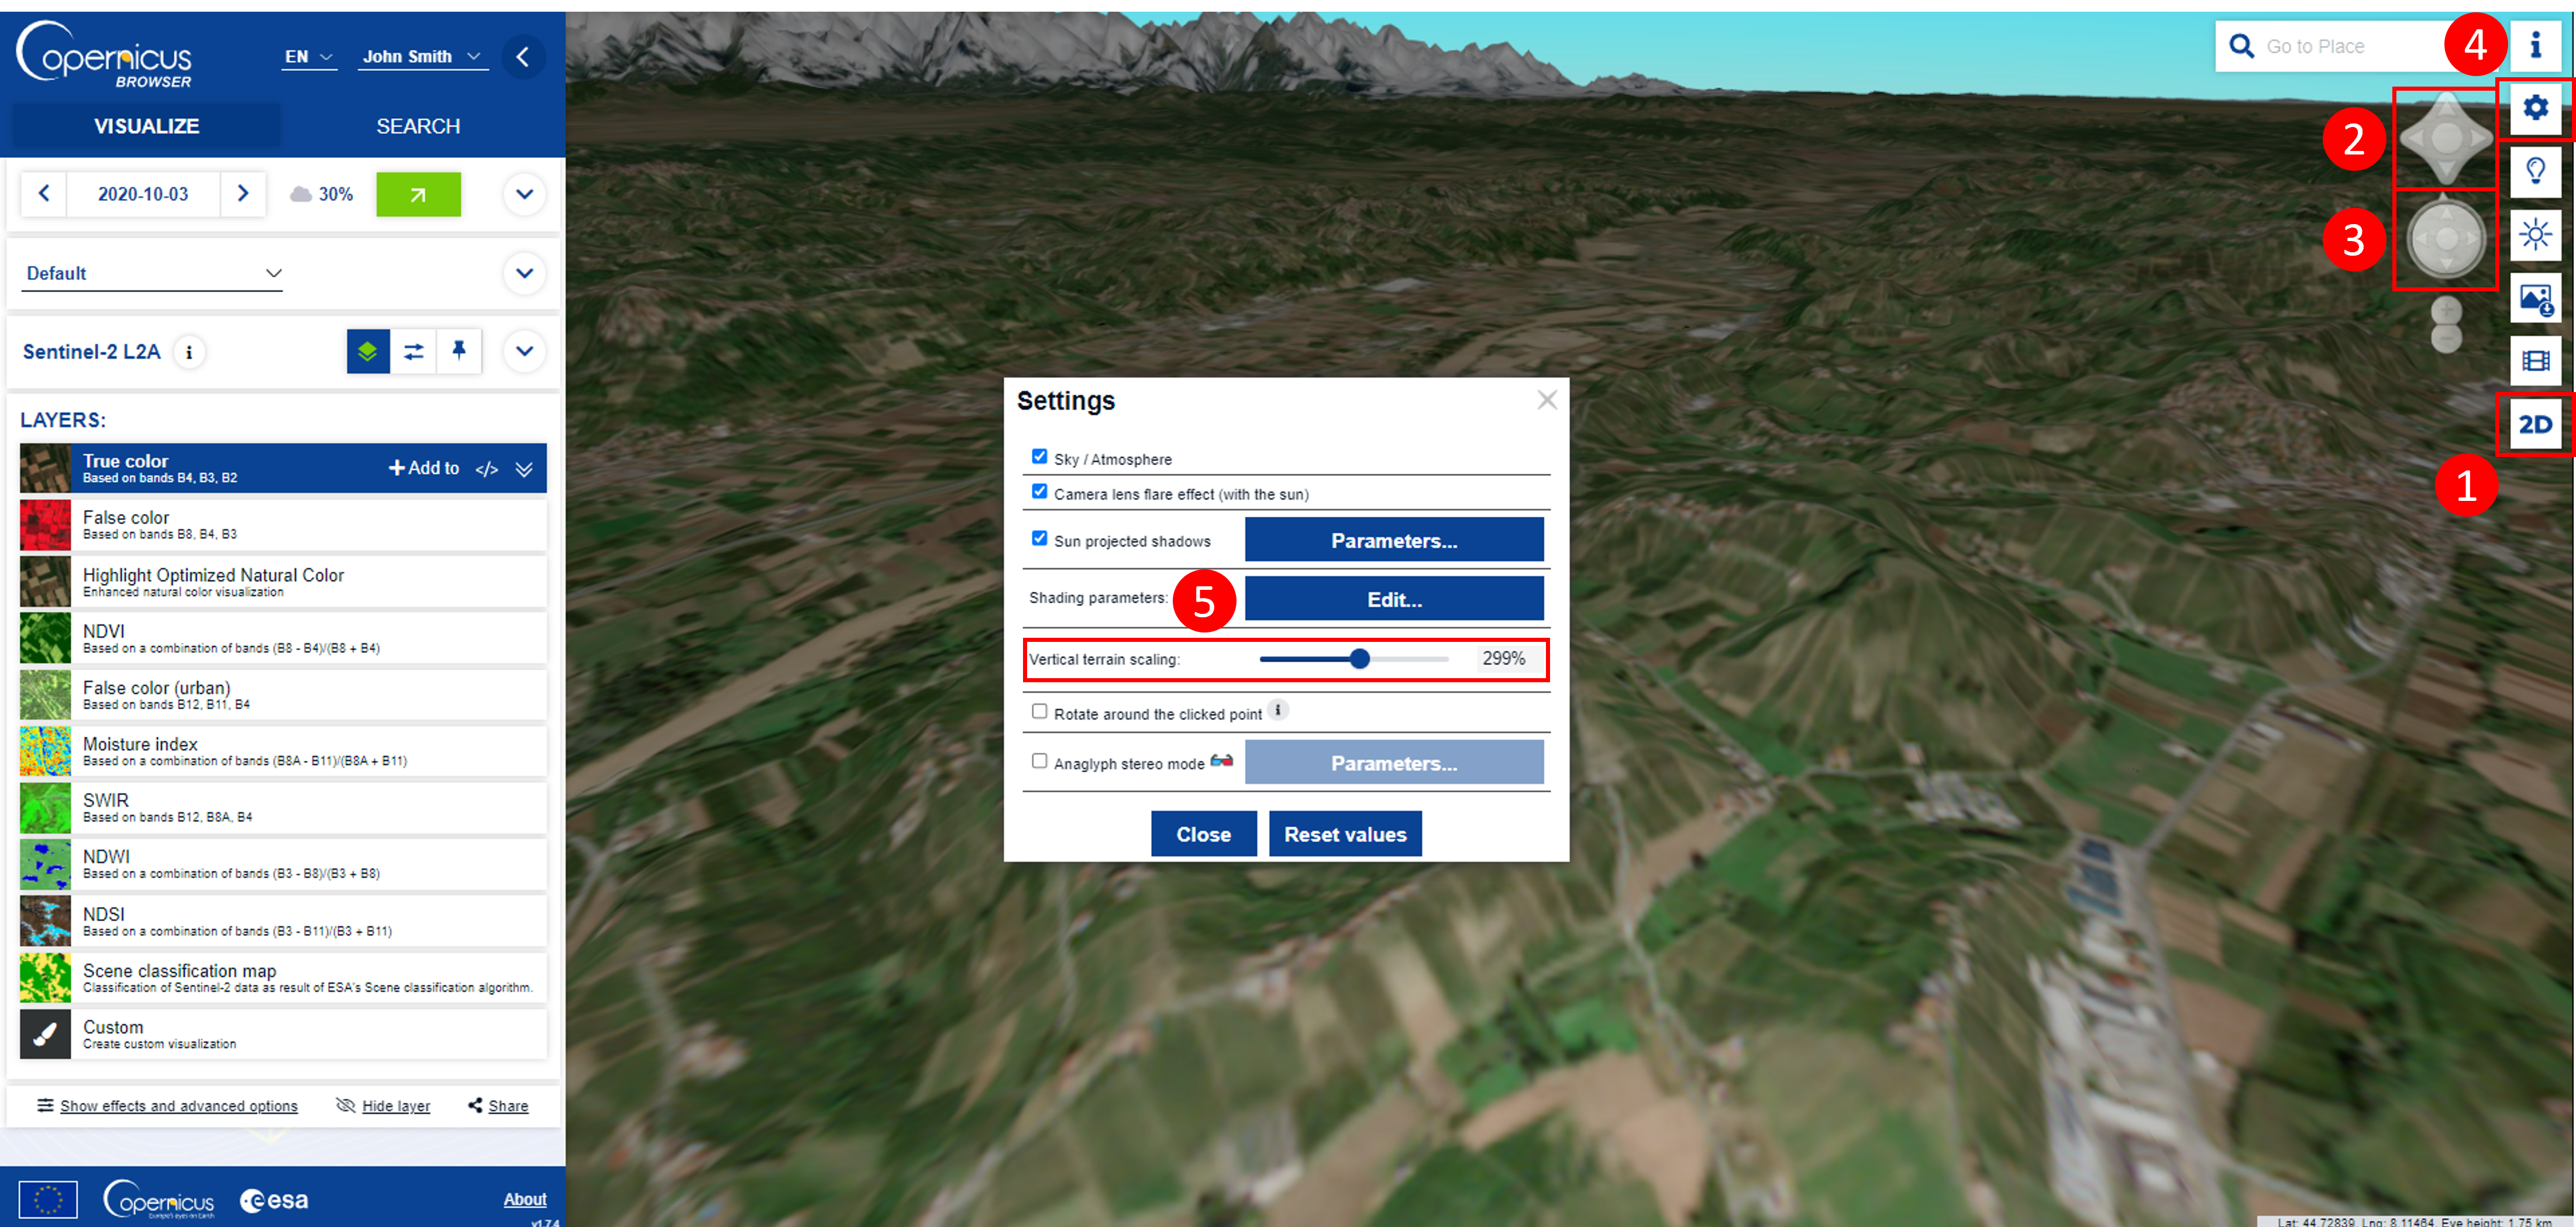
Fig. 2.2.3.1 – 3D Satellite image visualization in Copernicus Browser