6.1. What is the Global Human Settlement Layer (GHSL)
Global Human Settlement Layer (GHSL) is an open and free data and tool for assessing the human presence on the planet. The project aims to produce and analyse global built-up surface, population density and human settlement thematic maps to understand human presence on Planet Earth. The GHSL processing framework uses heterogeneous data including global archives of high-resolution satellite imagery, census data, and geographic information provided by the community. The data is processed fully automatically and generates analytics and knowledge reporting objectively and precisely about the presence of population and built-up infrastructures. In particular, GHS-POP is composed of a spatial raster dataset representing the number of people per cell. These estimations were done every 5 years between 1975 and 2020 and are also available projections for the years 2025 and 2030. Once you have opened the GHSL website you will be greeted by its homepage (Fig. 6.1.1) . From the menu on top of the homepage (1) you can reach other sections of the website that will be explained in the following chapter. The three main pages of the website: Data and tools, Visual analytics and Degree of urbanisation can be also reached using the dedicated section (2).
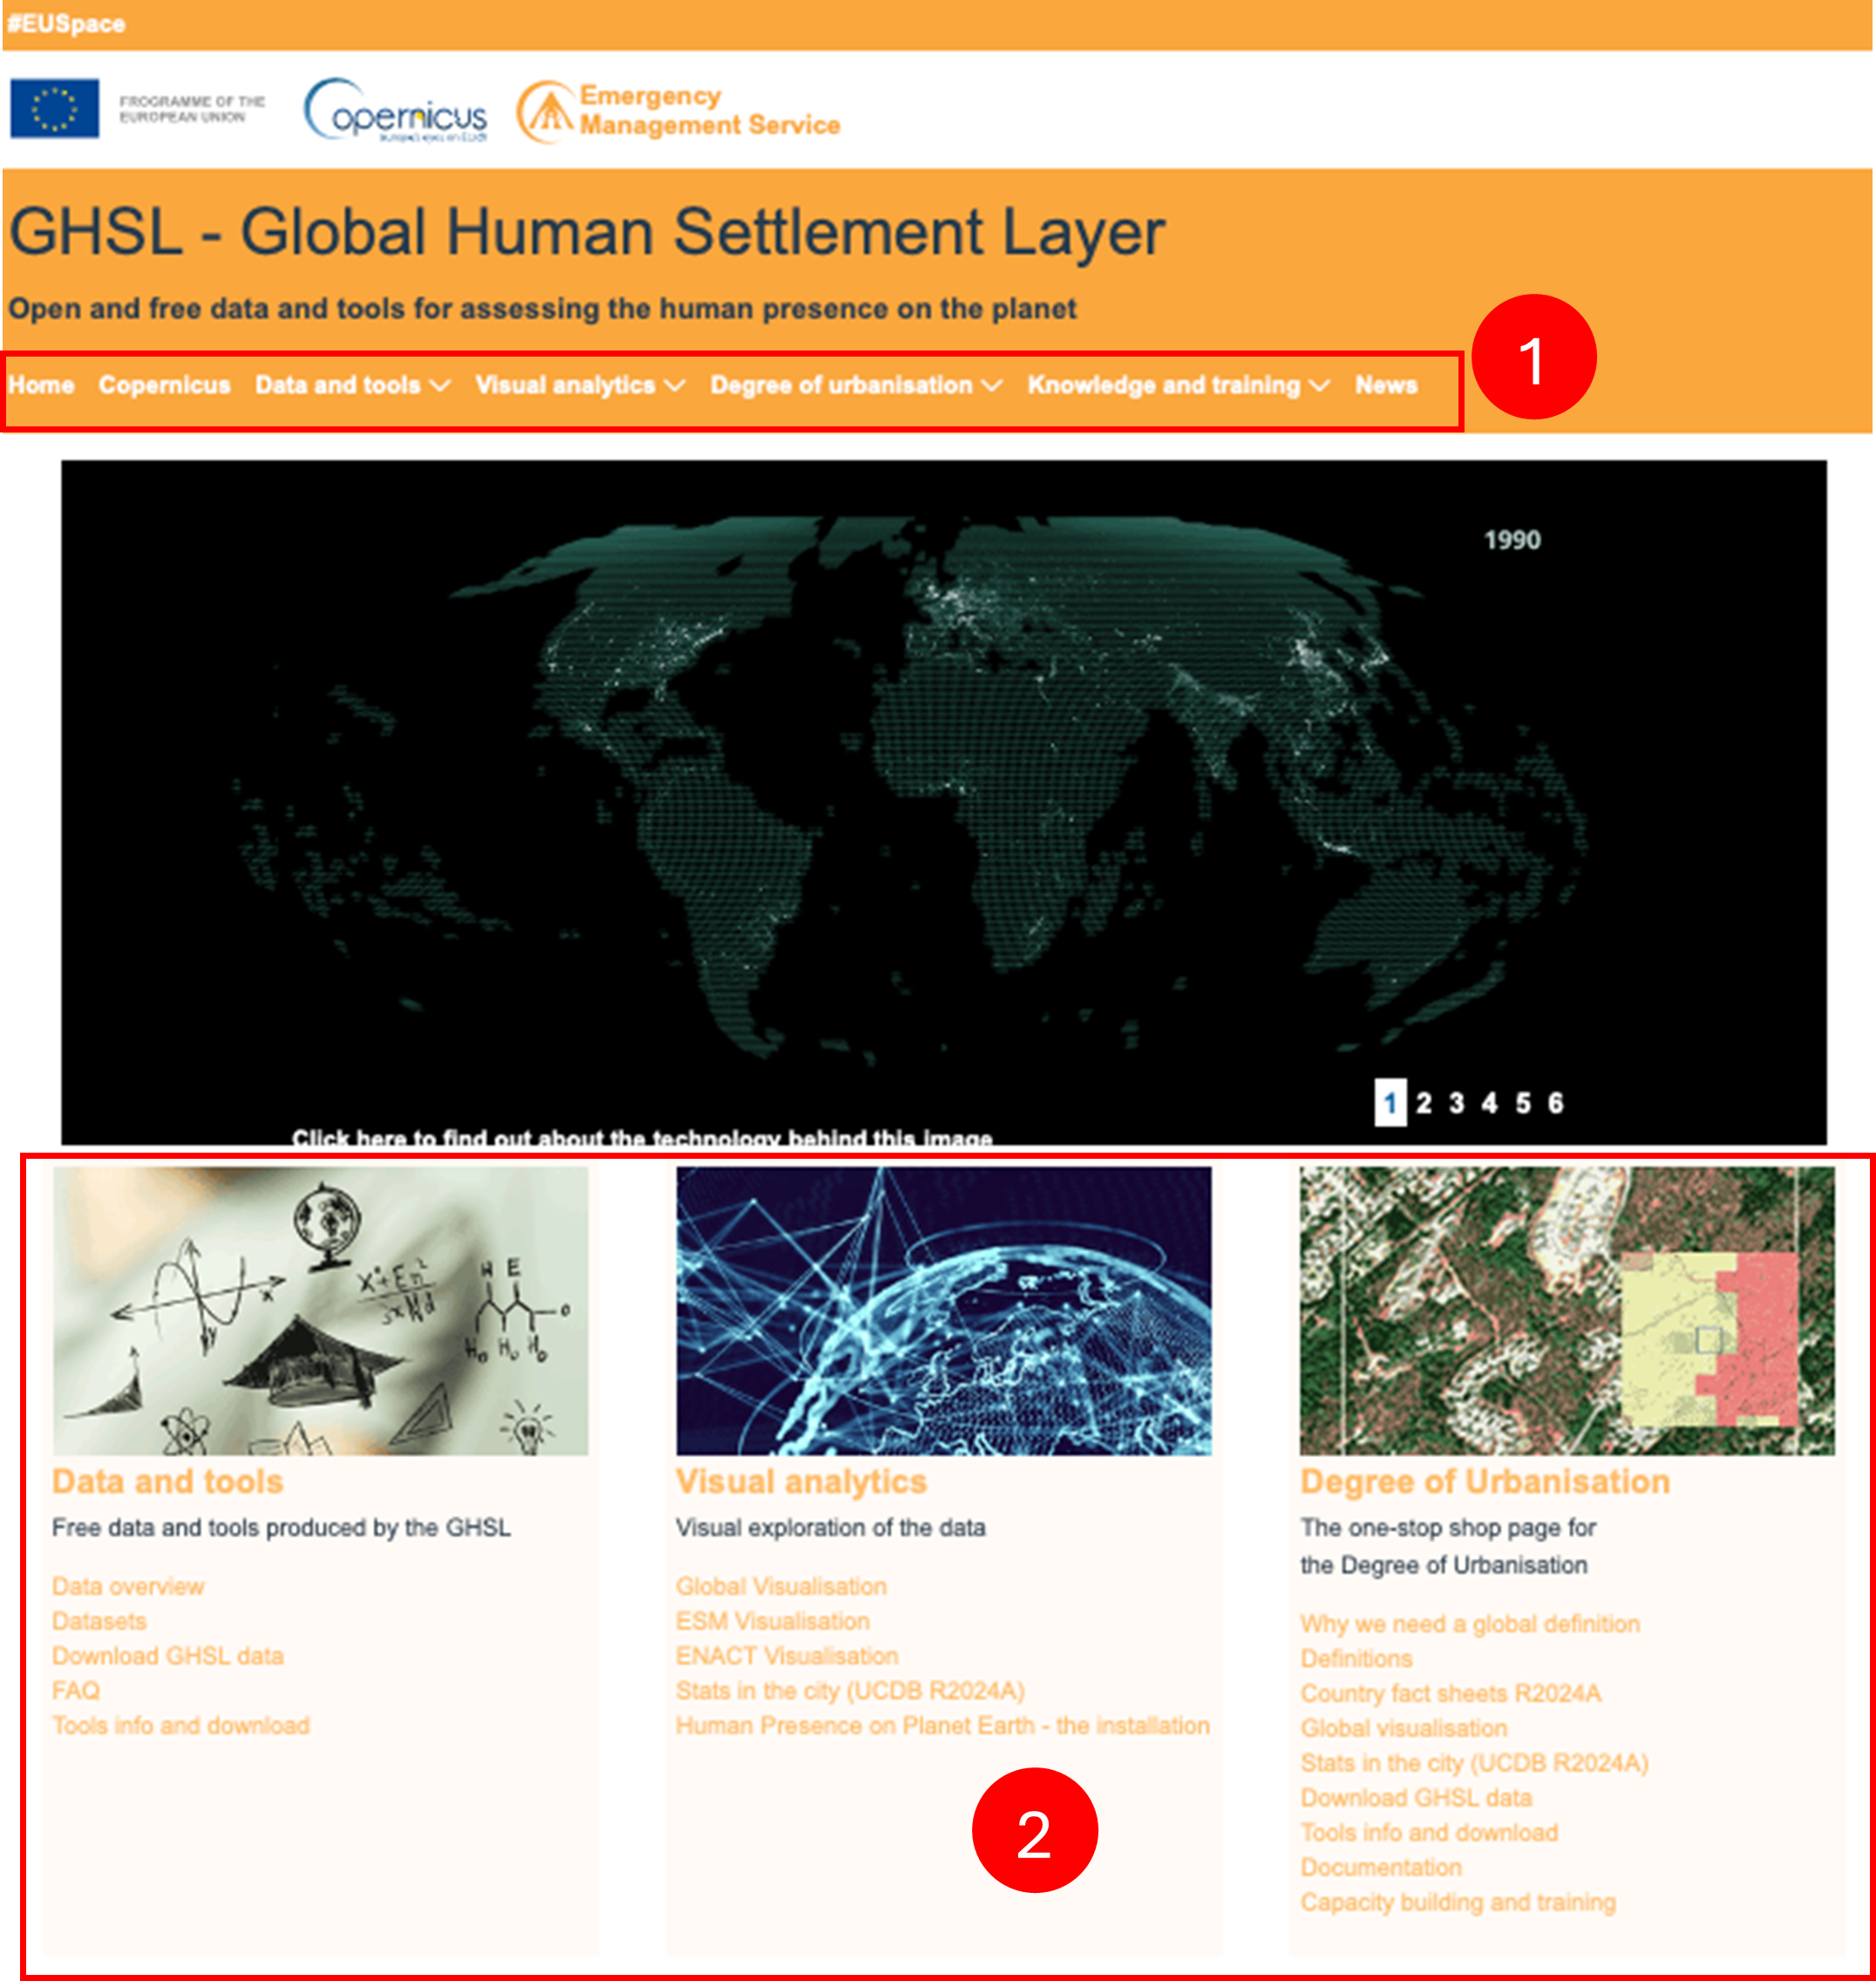
Fig. 6.1.1 – GHSL website - homepage pt.1
Scrolling down the webpage (Fig. 6.1.2) you will see first a series of links leading to technical aspects, projects and definitions which will be discussed later (1). Under that section, the latest news, events and publications are presented (2). Finally, with a blue background, there is a list of contacts of the institutions involved in the project along with policy and legal notes (3).
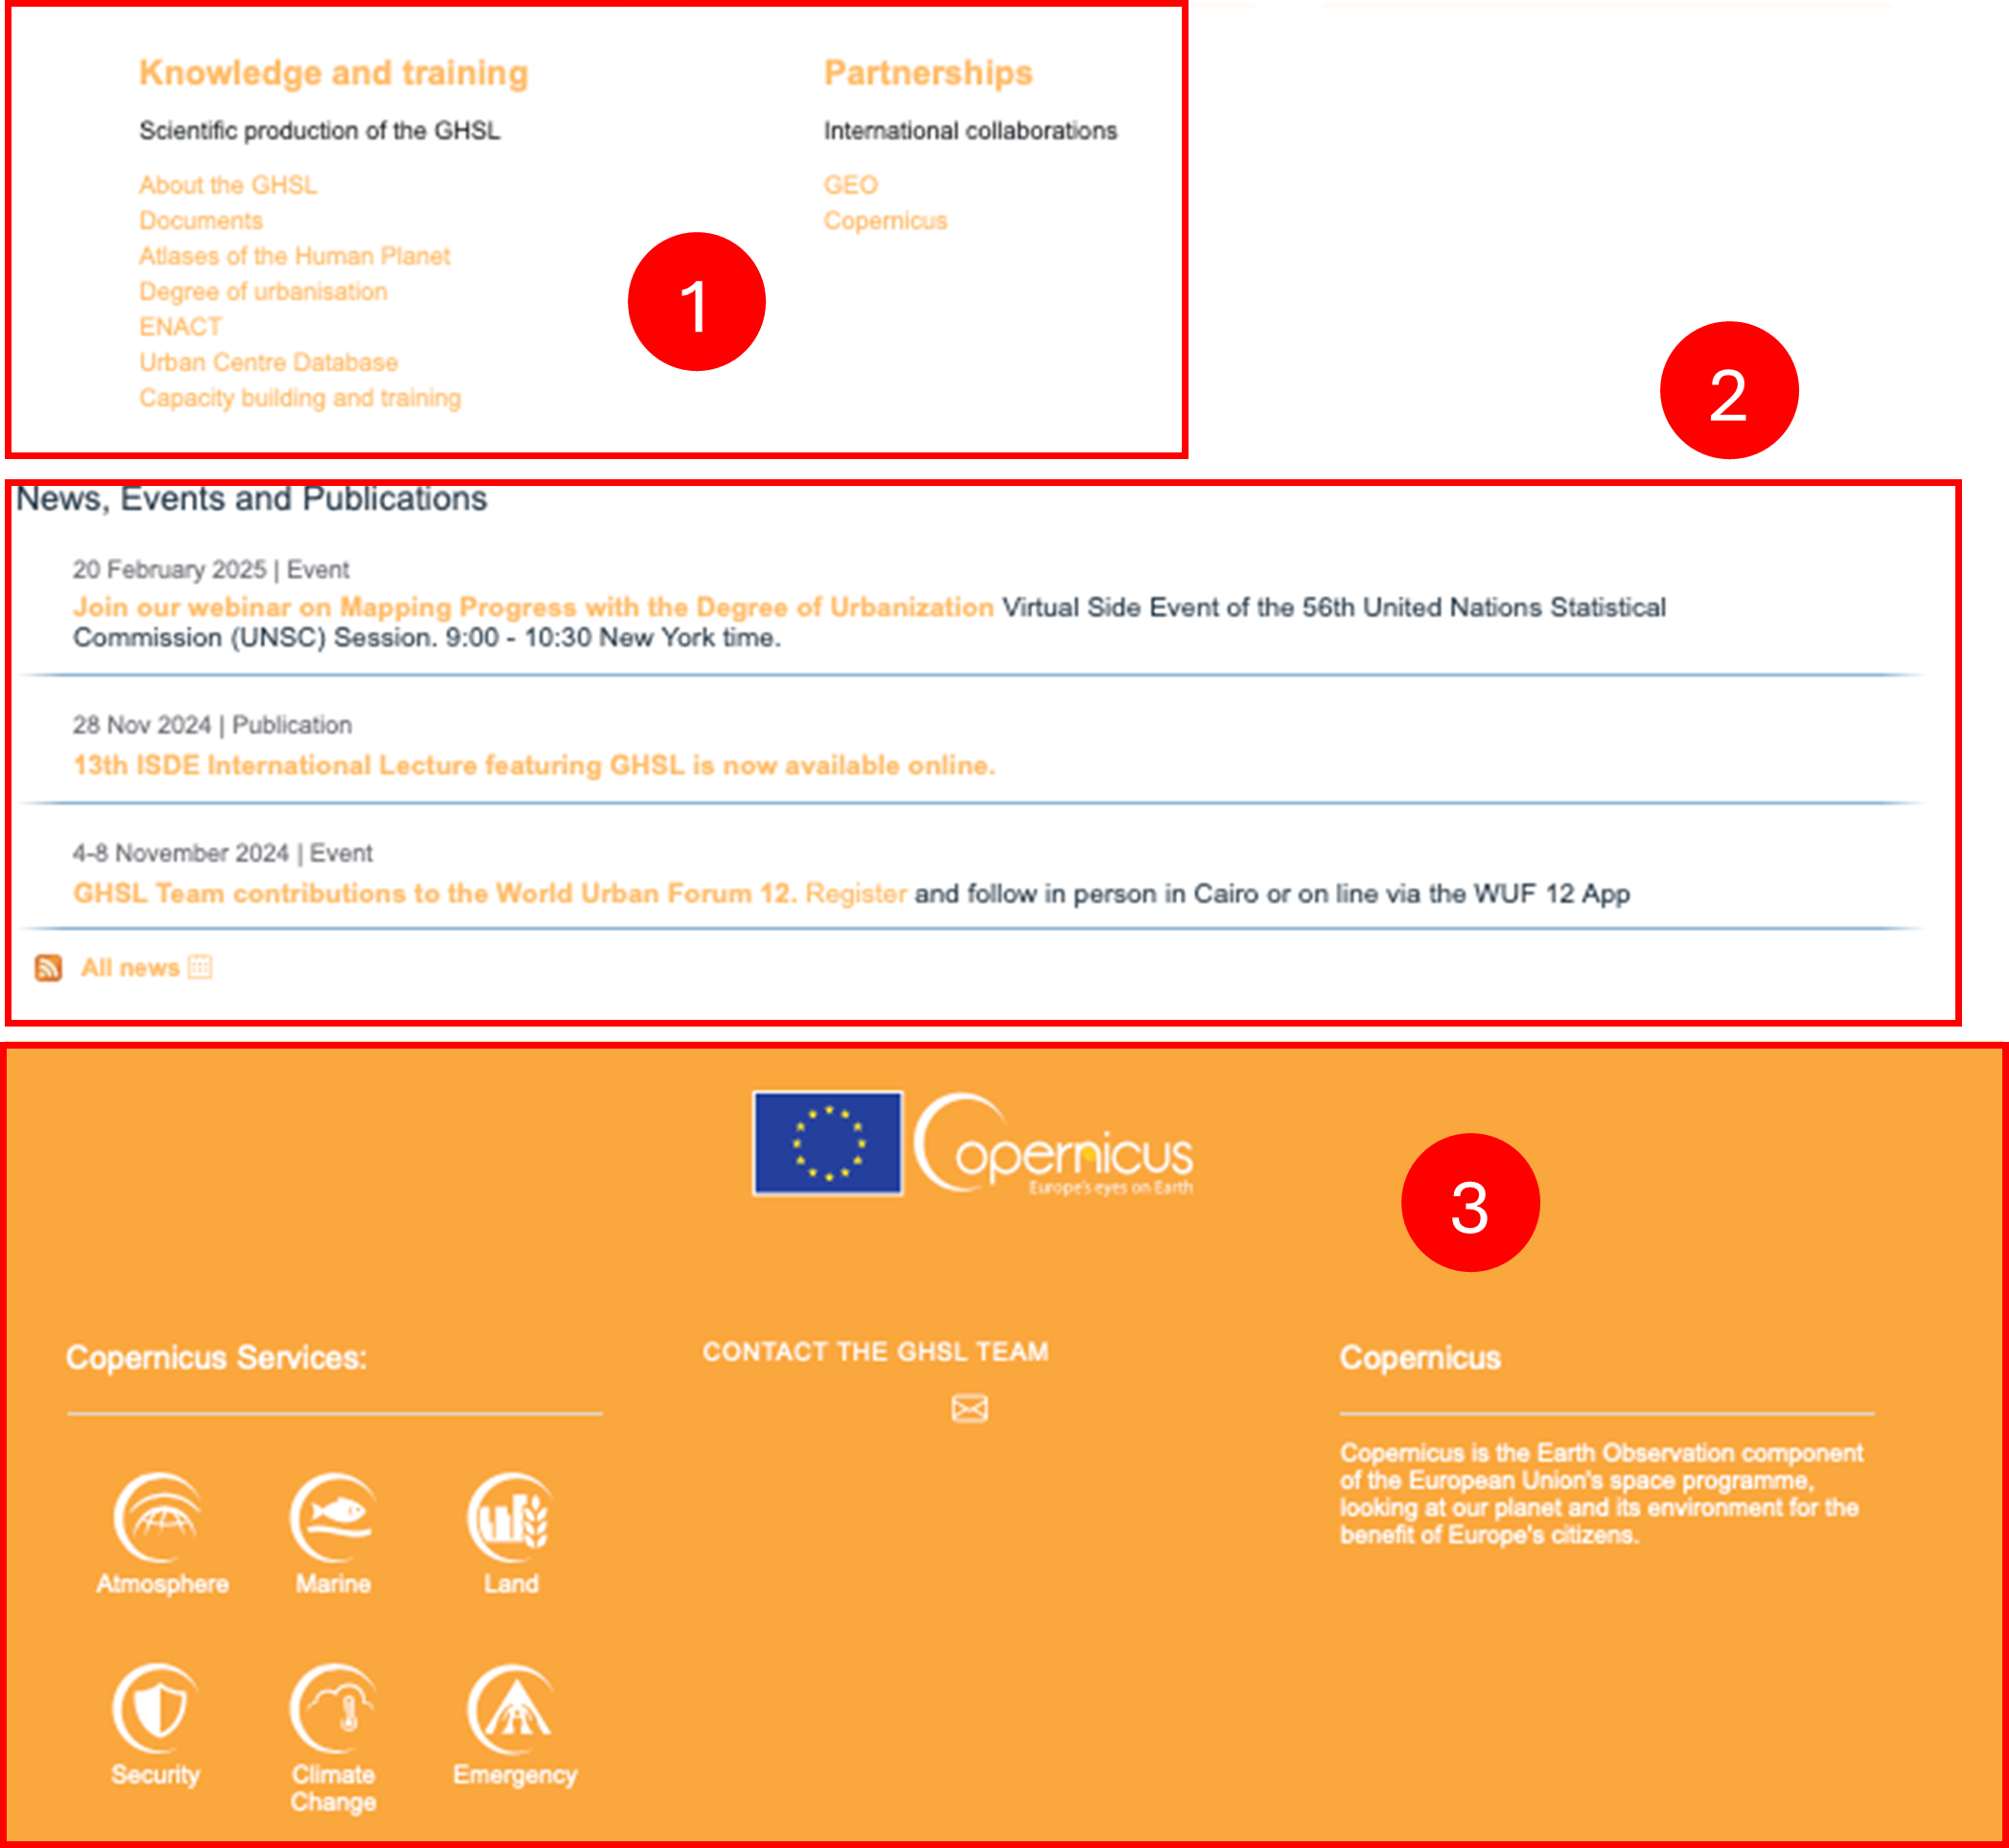
Fig. 6.1.2 – GHSL website - homepage pt.2
From the homepage, we can open the Copernicus page (Fig. 6.1.3) by clicking on Copernicus (1). The page contents are listed on the left side of the page (2). By clicking on the internal links on that section the page will automatically scroll to the desired argument. Apart from a brief introduction to Copernicus and GHSL. There is also a section dedicated to the CESM week which is an annual user workshop regarding Copernicus ESM and talking about the service’s purpose, its milestones, the contributing partners but also innovations, updated functionalities and added capabilities.

Fig. 6.1.3 – GHSL website - Copernicus
By clicking on Data and Tools (1) (Fig. 6.1.4) and then on Overview (2) it is possible to reach a page working in a similar way as the Copernicus page. This page is composed of an overview of data and tools produced by GHSL. As before, the page contents are listed on the left part of the screen (3).
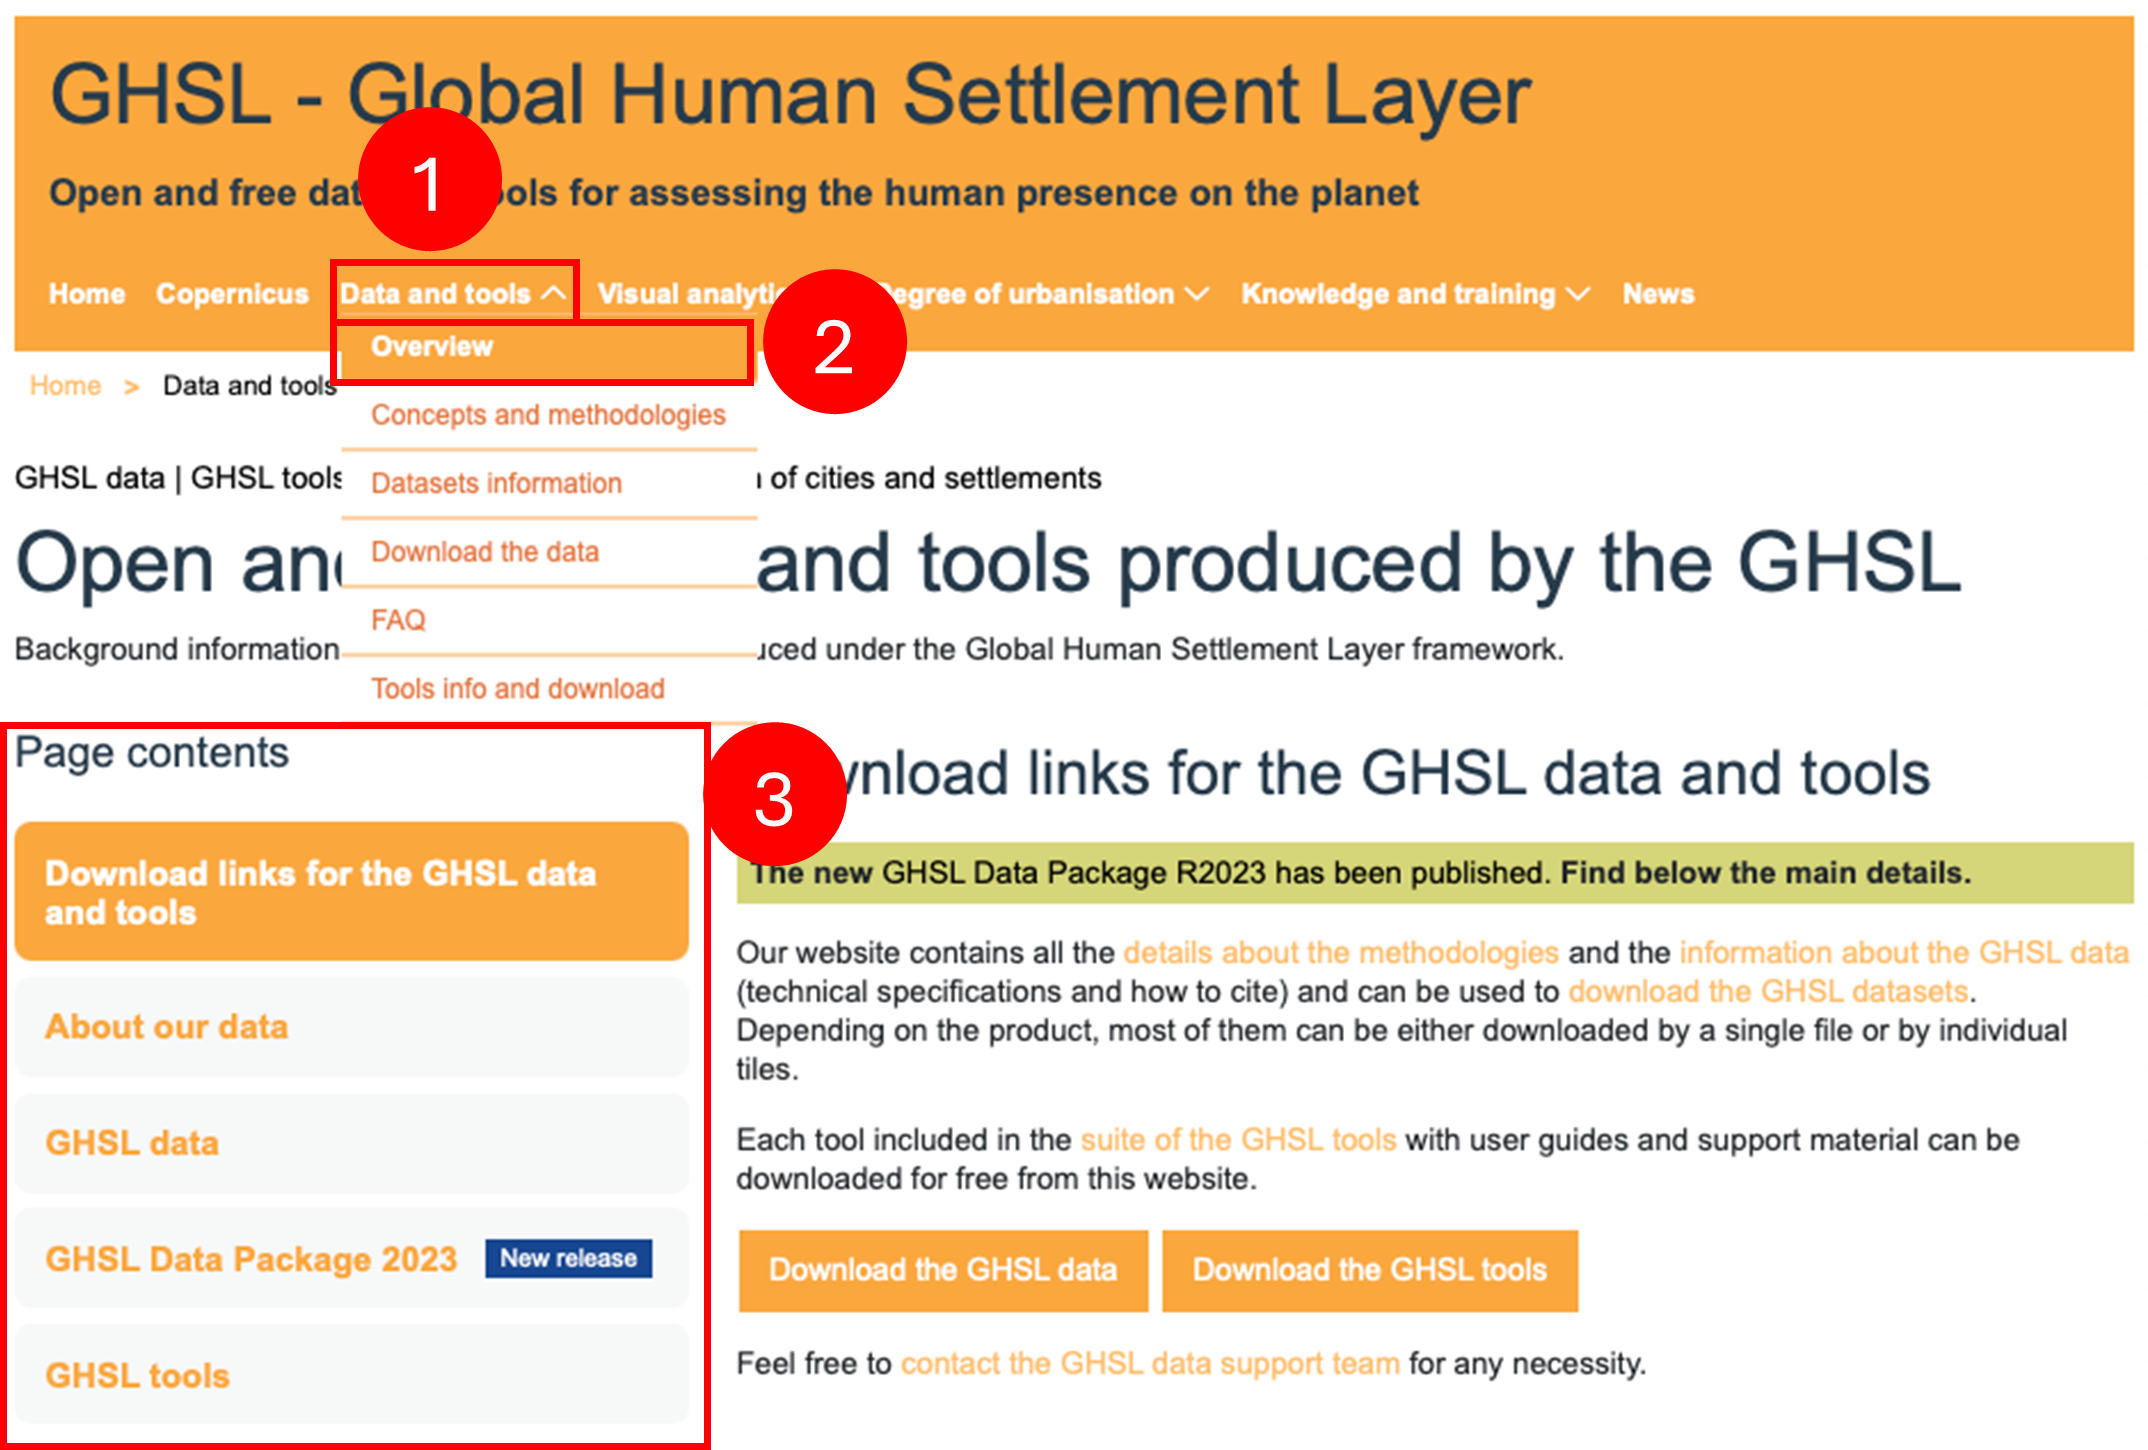
Fig. 6.1.4 – GHSL website - Data and Tools
Instead of clicking directly on Data and Tools (Fig. 6.1.5) it is possible to move the mouse over it (1) and select the Concepts and Methodologies (2) page from the drop-down menu. By making use of the buttons under the image (3) it is possible to visualize the GHSL methodology schema.
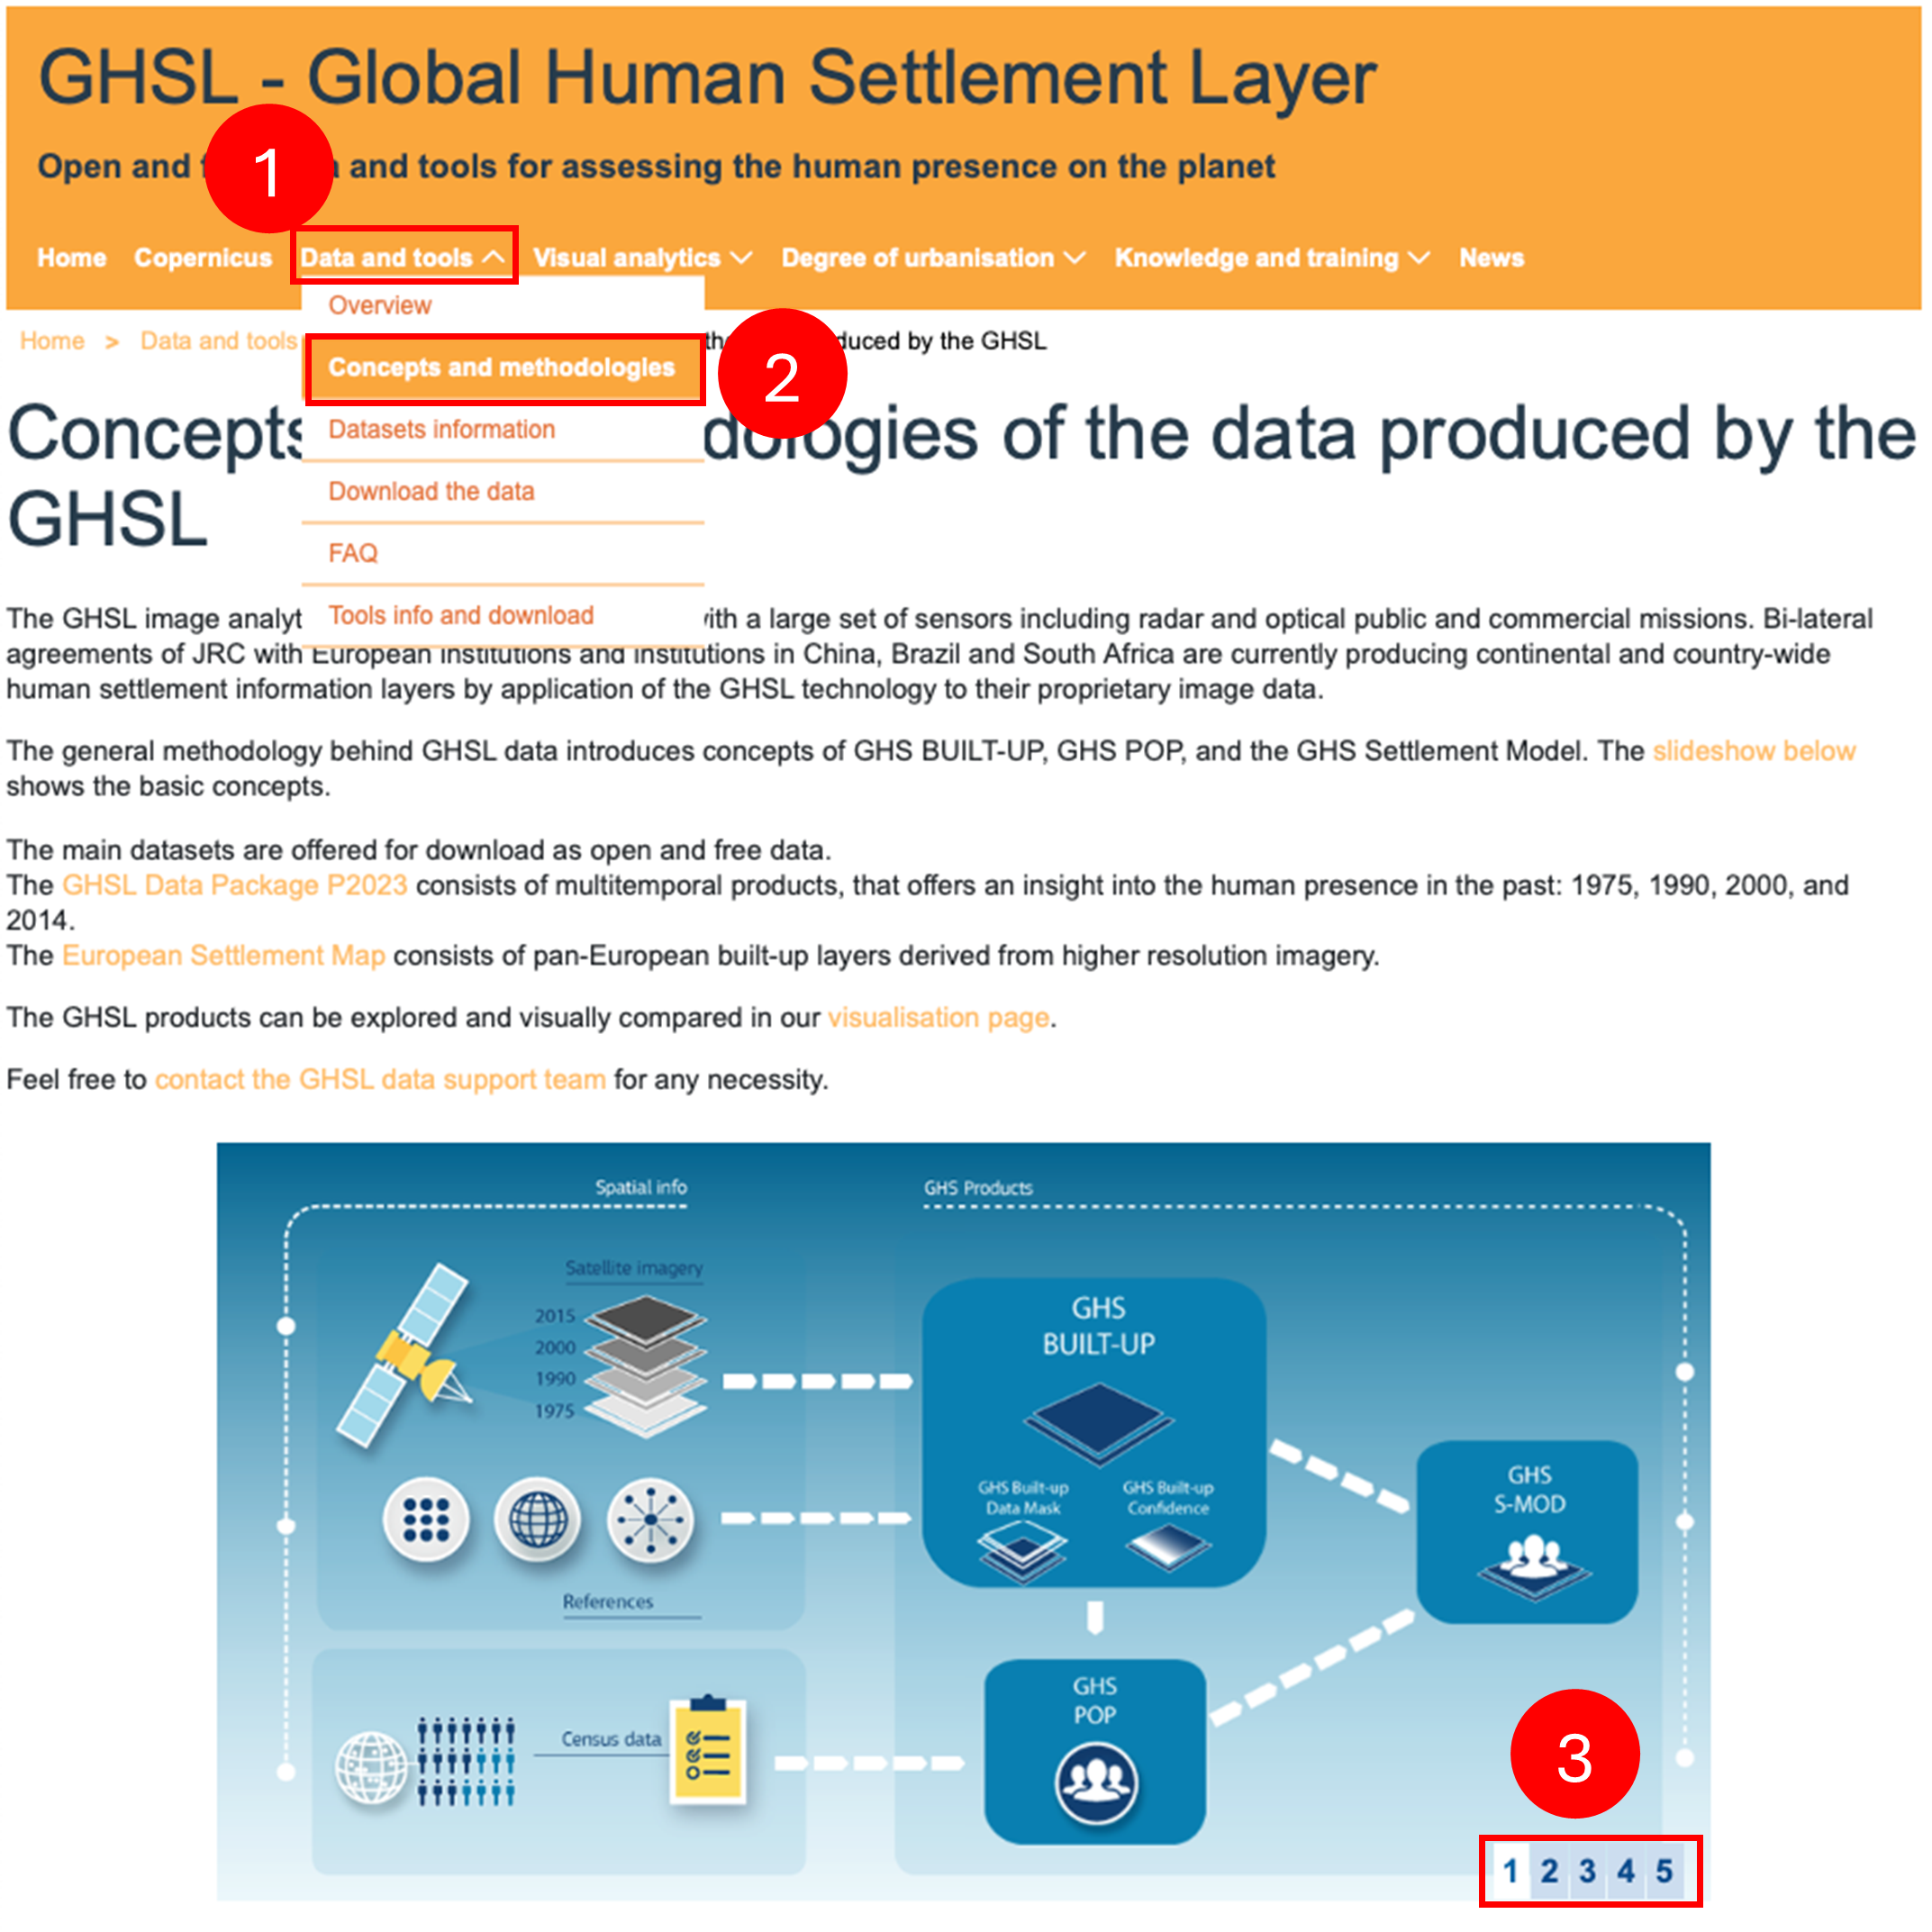
Fig. 6.1.5 – GHSL website - Data and Tools - Concepts and methodologies
From the Data and Tools (Fig. 6.1.6) drop-down menu it is possible to open the Datasets information page (1) by clicking on it.
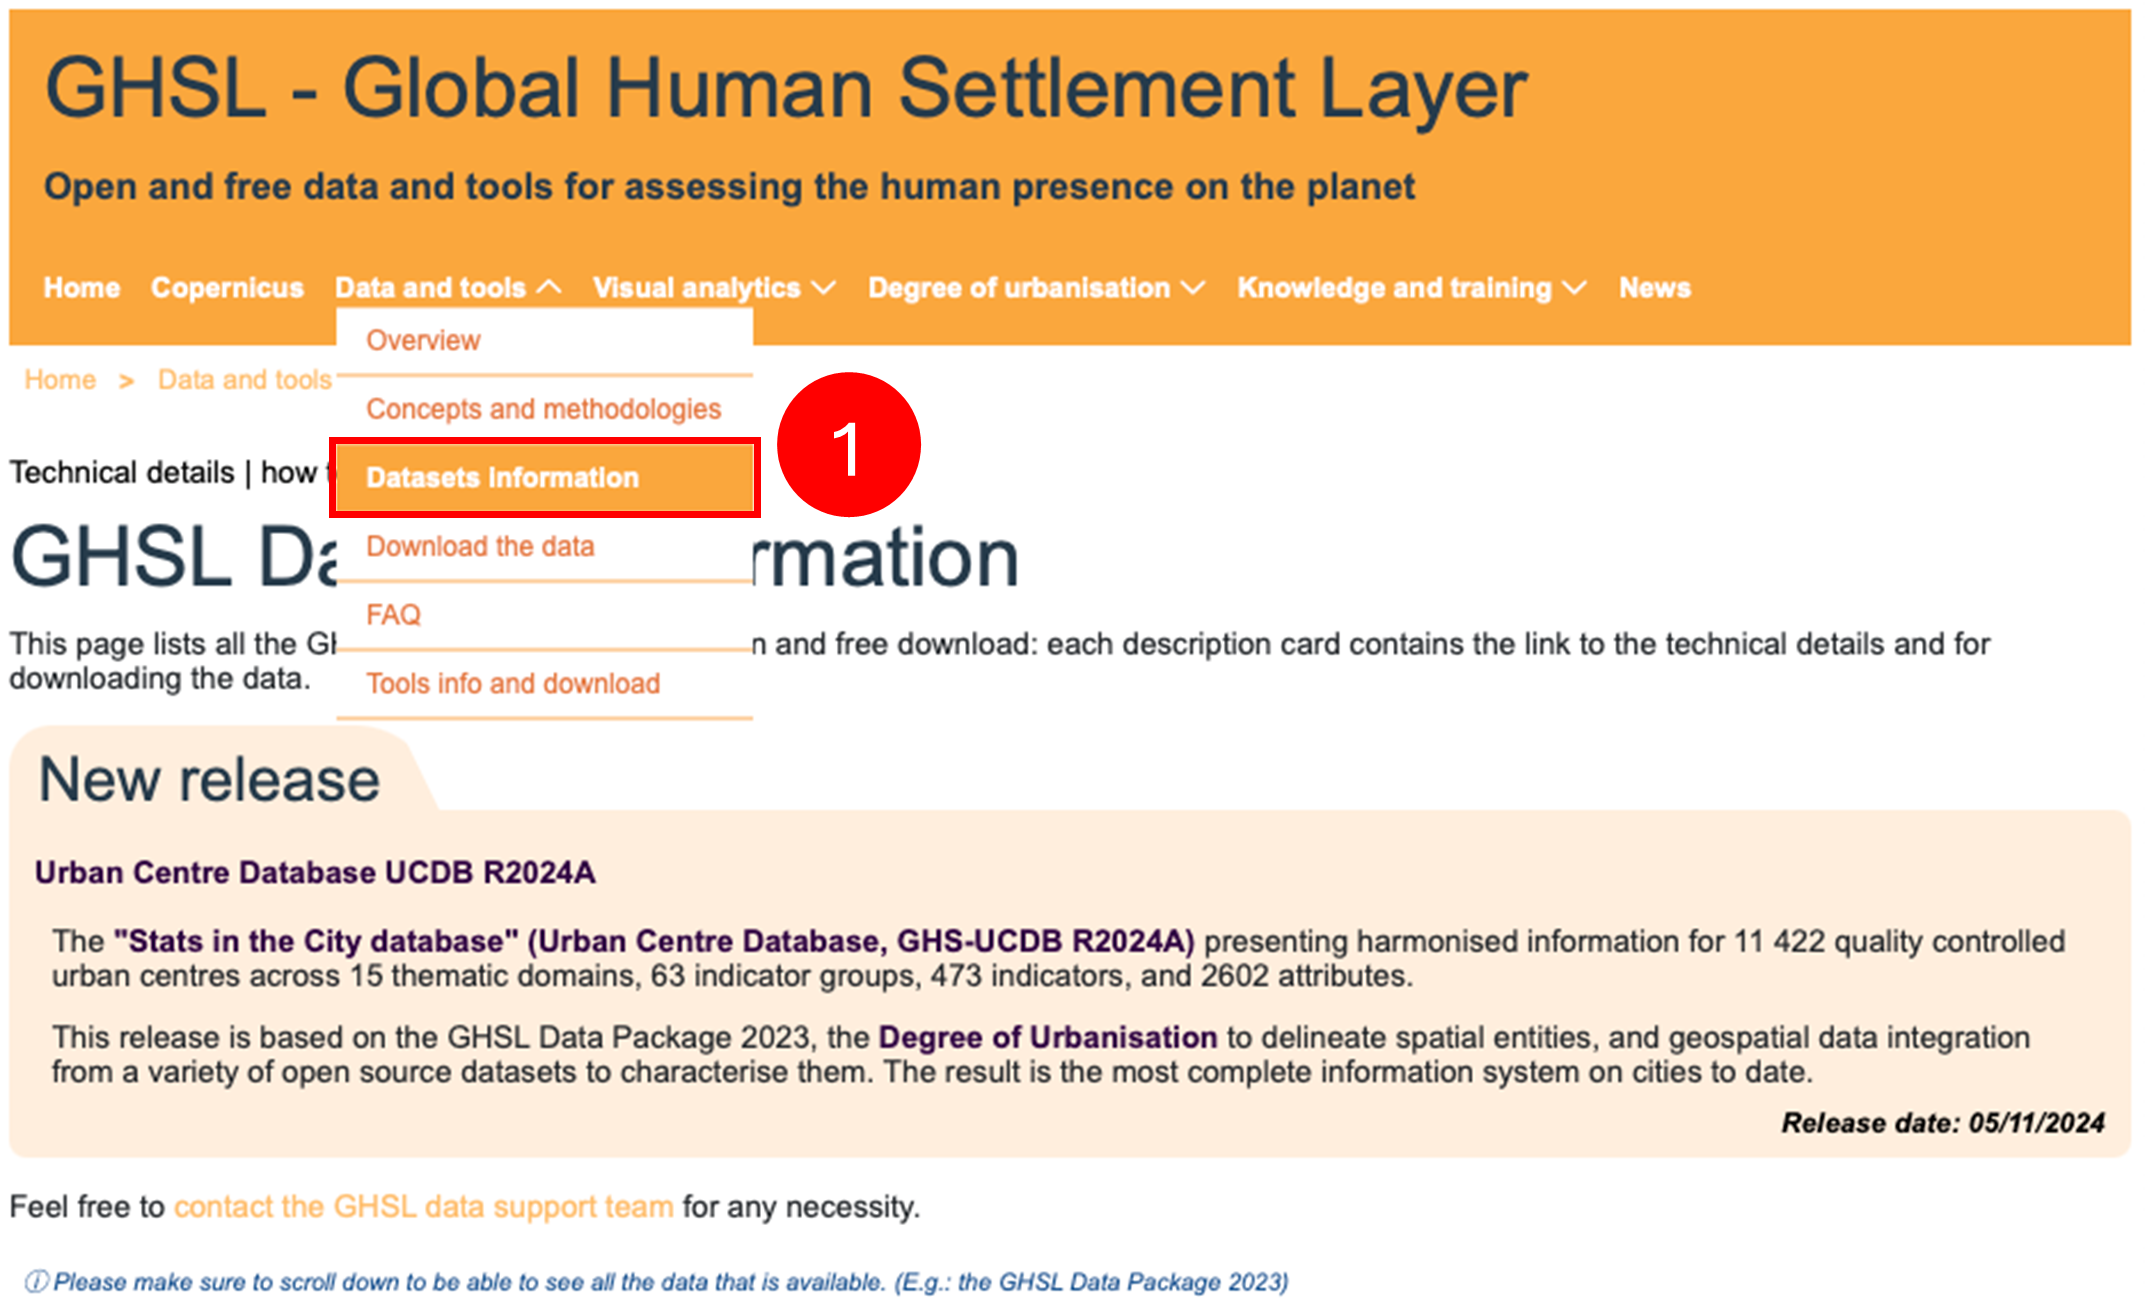
Fig. 6.1.6 – GHSL website - Data and Tools - Datasets information pt.1
Scrolling down, a list of all GHSL datasets will be presented (Fig. 6.1.7) with the option to click on a yellow download button (1) which will transport you to the page relative to the selected product. By clicking on How to cite it will be possible to find a few lines that you need to report in case you are utilizing some information taken from the corresponding GHSL dataset. The list of all GLOBAL COVERAGE products will be reported here:
- GHS-BUILT-S shows the spatial distribution of built-up surfaces, expressed in square meters.
- GHS-BUILT-H shows the spatial distribution of the building heights per cell
- GHS-BUILT-V shows the spatial distribution of built-up volumes, expressed in cubic meters
- GHS-BUILT-C shows the spatial domain of all the built-up at a local scale of approximately 100m, this defines the Morphological Settlement Zone (MSZ). It also describes the internal classification of the morphology and what the built environment is used for.
- GHS-POP shows the population distribution, expressed as the number of people per cell
- GHS-SMOD shows the changes in the degree of urbanization over a period currently ranging from 1975 to 2030.
- GHS-DUC shows the degree of urbanization classification of administrative units
- GHS-LAND shows the land fraction per pixel
- GHS-composite-S2 R2020A is a composite layer of sentinel 2 blue, green red and near infrared bands with a spatial resolution of 10 meters. The composition is used to obtain an image of the Earth free from clouds.

Fig. 6.1.7 – GHSL website - Data and Tools - Datasets information pt.2
Other GHSL products are reported here (Fig. 6.1.8):
SUPPORTING DATA:
- GHS-SDATA are intermediary data used to facilitate the production and quality control of R2023A.
ANALYTICAL DATA:
- GHS-BUILT-LAUSTAT contains the summary statistics of GHS-BUILT-S from 1975 to 2020 in 5 years intervals expressed in km
- Urban Centre Database UCDB R2019A describes Urban Centers according to a series of multitemporal thematic attributes. Urban Centers are spatial entities defined via a threshold over resident population and built-up surface proportion
- GHS-FUA describes the boundaries of Functional Urban Areas (FUA) of Urban Centres in 2015. These areas are classified through an automatic procedure
REGIONAL COVERAGE:
- ENACT-POP shows seasonal nighttime and daytime population grids for 2011, expressed as the number of people per cell
- ESM 2015 - R2019 maps human settlements in Europe based on Copernicus Very High-Resolution optical coverage for the reference year 2015
- ESM 2012 is similar to ESM 2015 - R2019 but it is based on GHSL methodology applied to SPOT5 and SPOT6 satellite imagery
PROJECTIONS:
- BUILT-POP PROJ R2020 it is a data package containing the Built-up area and Population grids projected to 2100 with a 10 years interval
- SMOD PROJ R2020 it is a data package containing settlement layers projected to 2070 with a 10 years interval

Fig. 6.1.8 – GHSL website - Data and Tools - Datasets information pt.3
From the Data and Tools drop-down menu (Fig. 6.1.9) it is possible to open the Download the data page (1) by clicking on it. The functionality of this page will be explained in chapter 6.1.1 . Substantially it will allow the download of specific products based on many factors such as the resolution, the area of interest, the year etc.
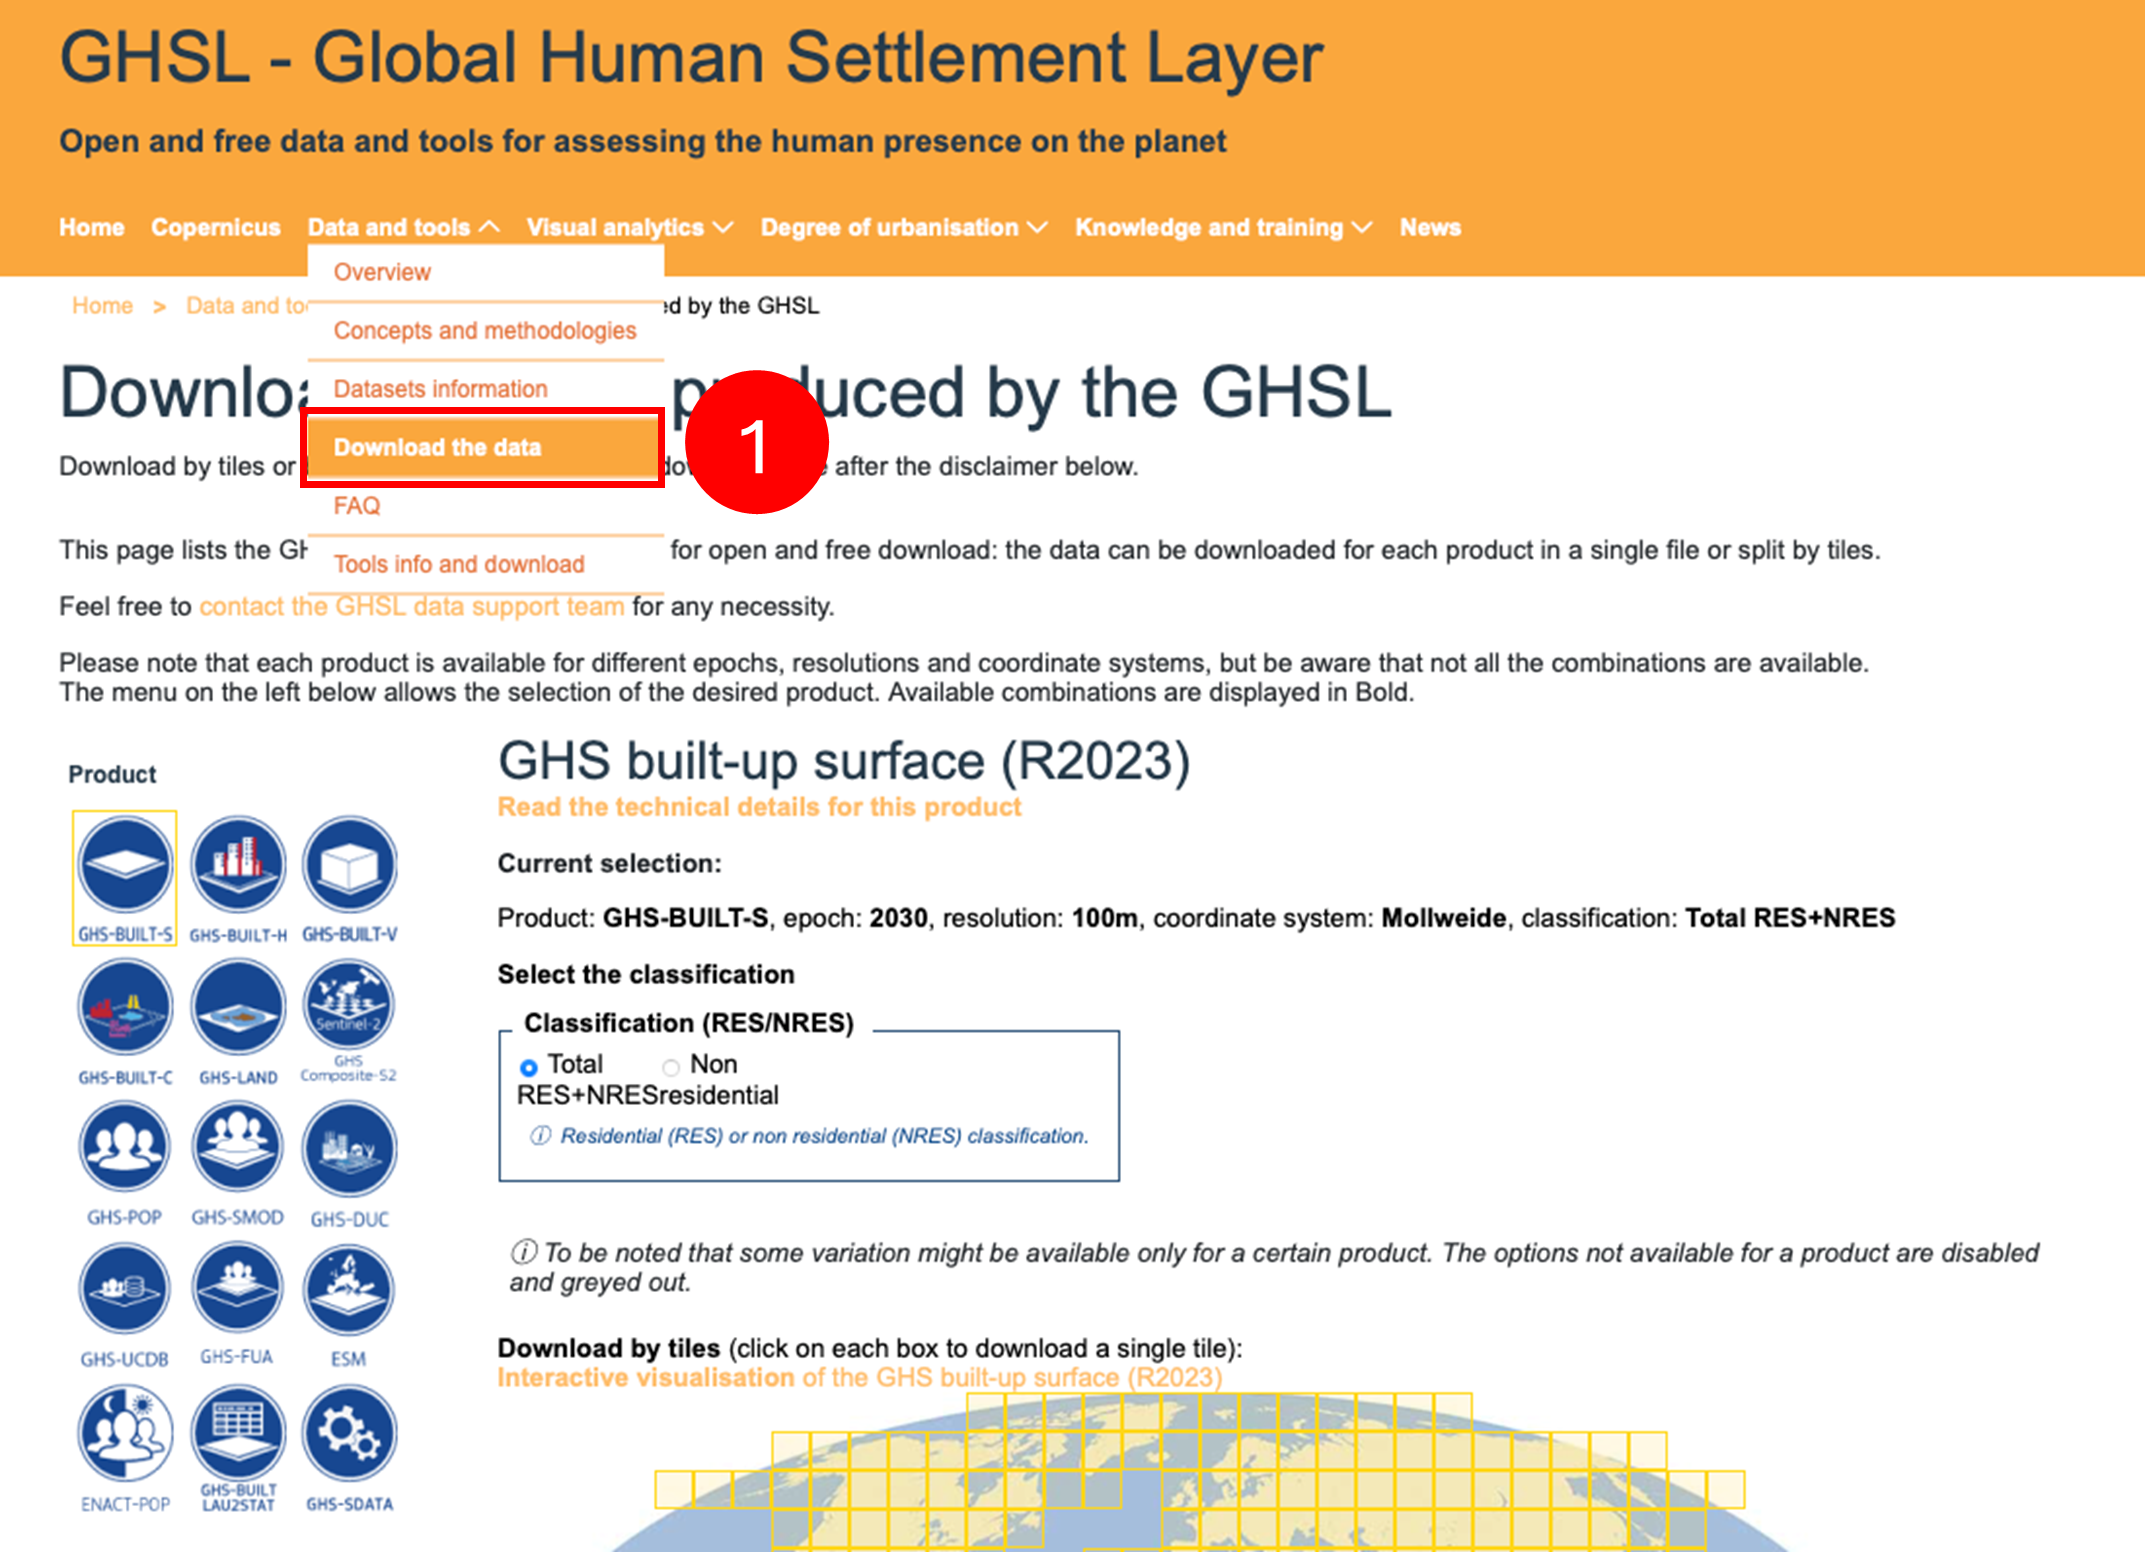
Fig. 6.1.9 – GHSL website - Data and Tools - Download the data
From the Data and Tools drop-down menu (Fig. 6.1.10) it is possible to open the FAQ (frequently asked questions) page (1) by clicking on it. Here it is possible to find answers to the most common questions regarding GHSL
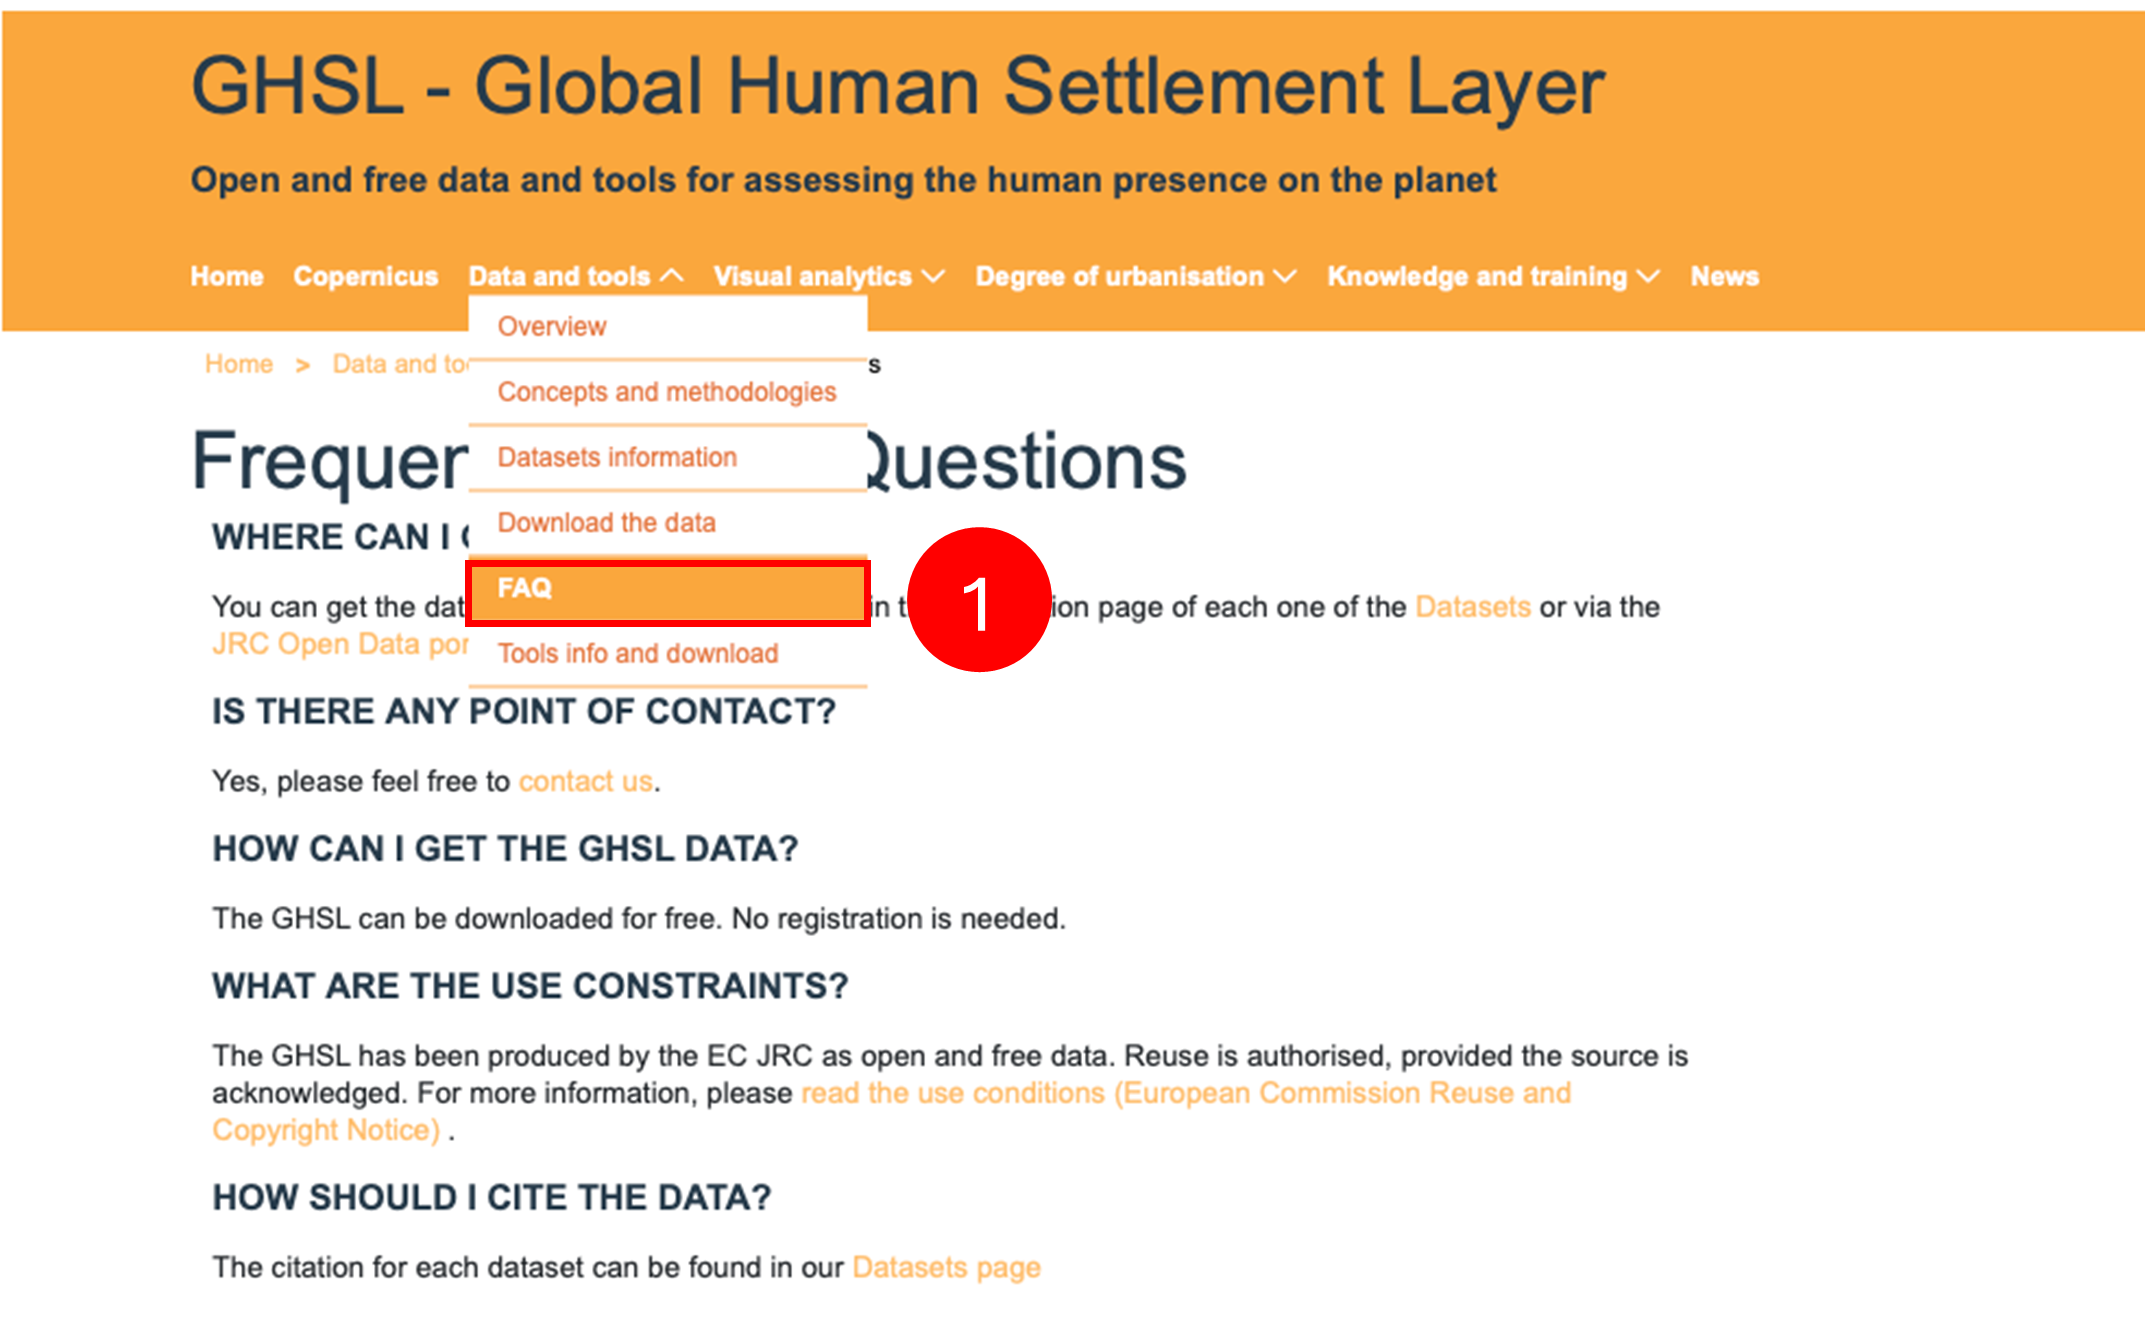
Fig. 6.1.10 – GHSL website - Data and Tools - FAQ
From the Data and Tools drop-down menu (Fig. 6.1.11) it is possible to open the Tools info and download page (1) by clicking on it. In this page, all tools developed and used for GHSL are listed. This policy aims to facilitate users in reproducing GHSL results. For each tool it is possible to select Version (2) and Installation type (3) before clicking on the download button (4).
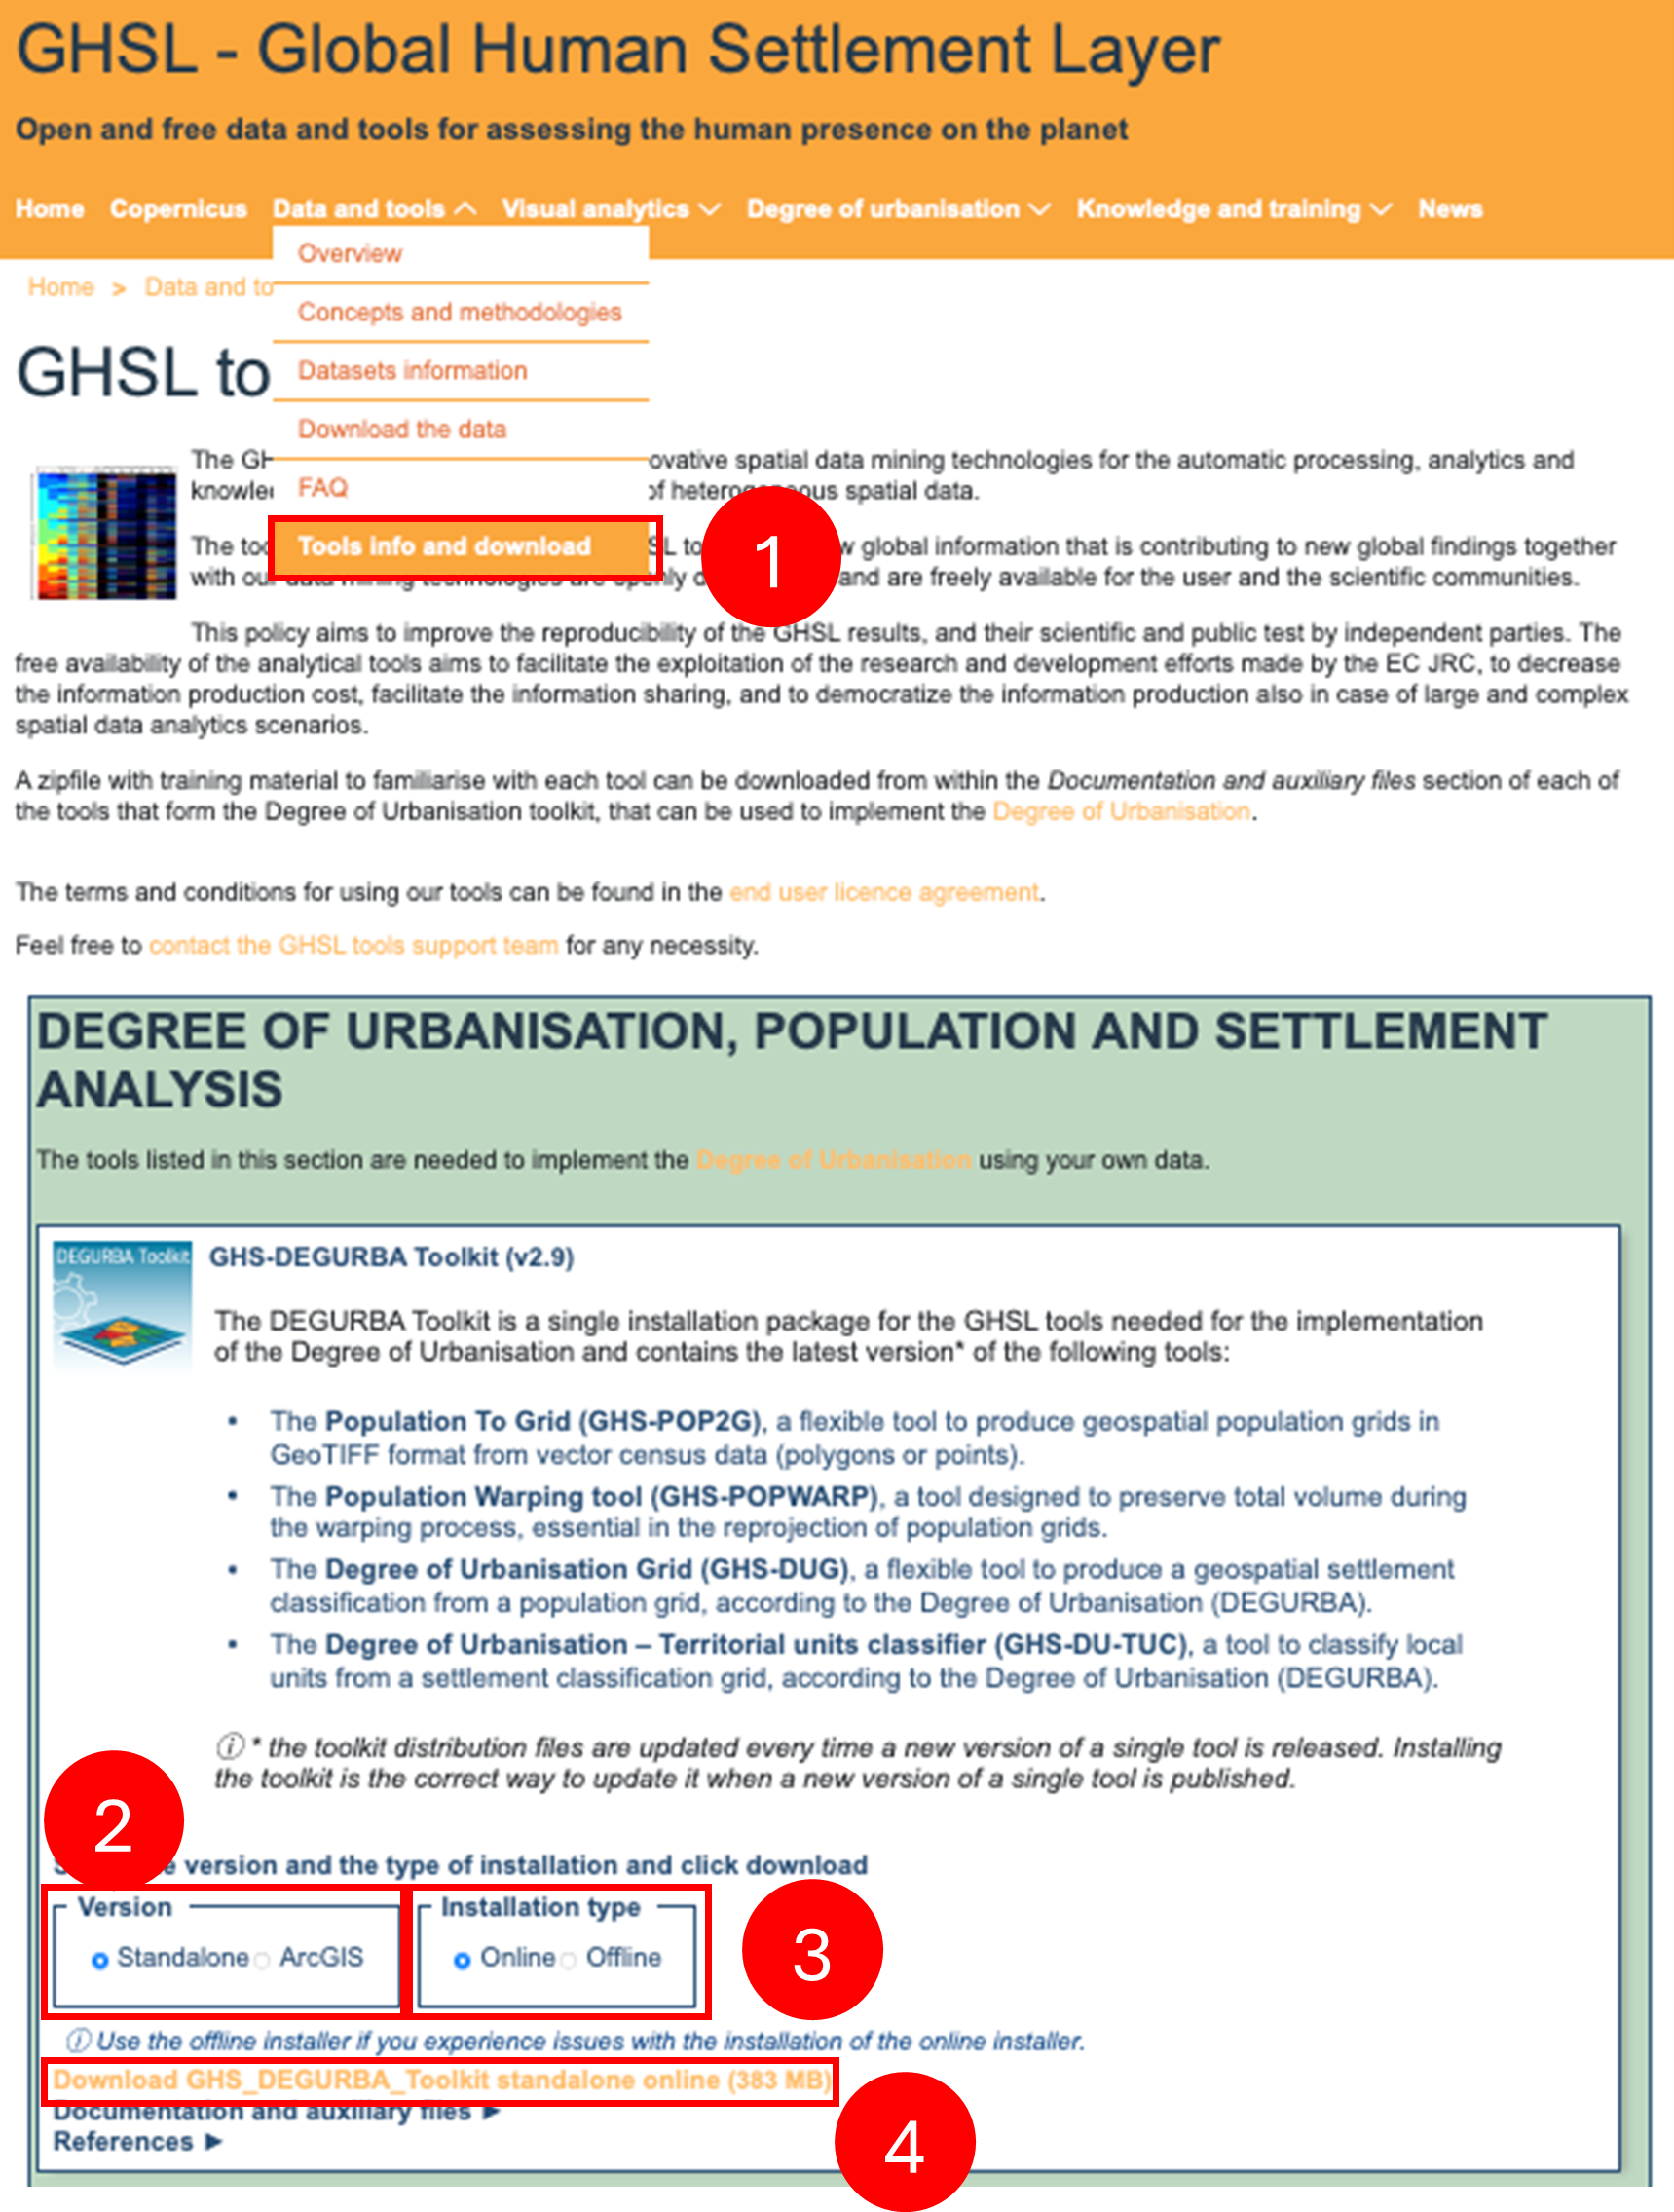
Fig. 6.1.11 – GHSL website - Data and Tools - Tools info and download
Clicking on Visual Analytics (1) (Fig. 6.1.12) and then on Overview (2) will open a page from which it is possible to check each GHSL product’s detailed information by opening the relative pages.
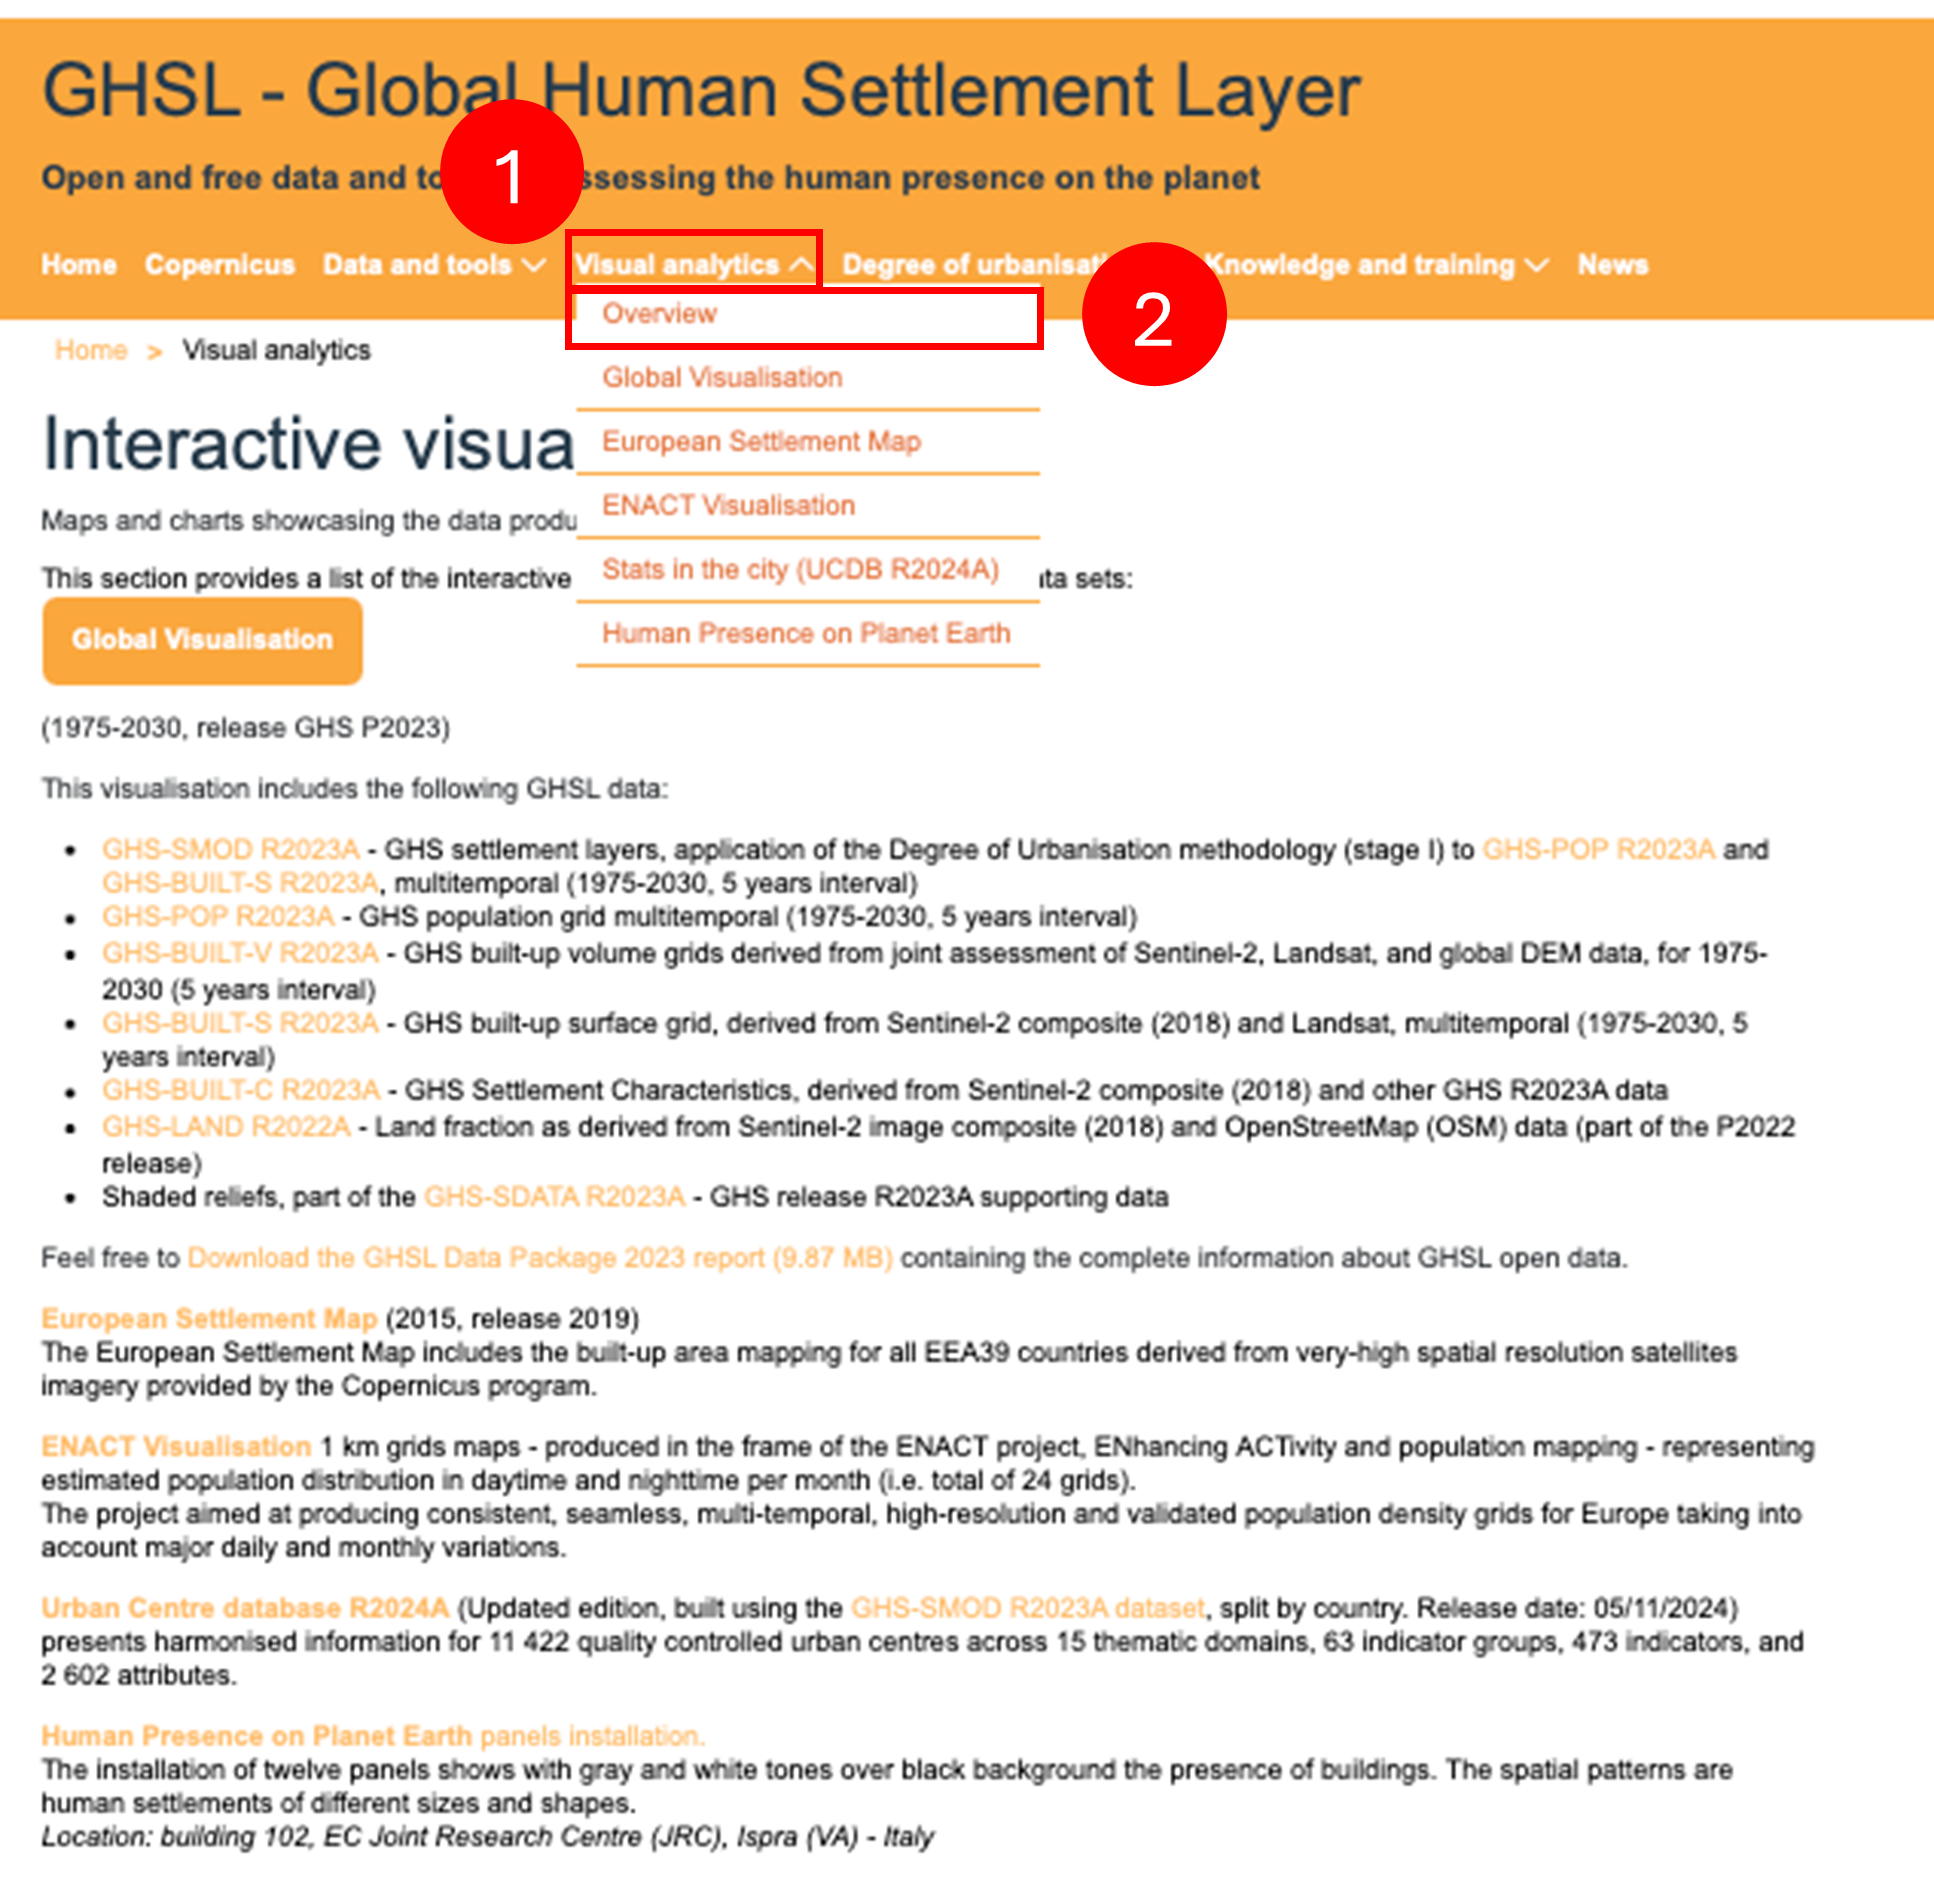
Fig. 6.1.12 – GHSL website - Visual analytics
From the drop-down menu of the Visual analytics (Fig. 6.1.13) . It is possible to visualize GHSL interactive maps, in particular Global Visualization (1), European Settlement Map R2019 (2), ENACT-POP R2020A (3) and Urban Centre Database UCDB R2019A (4).
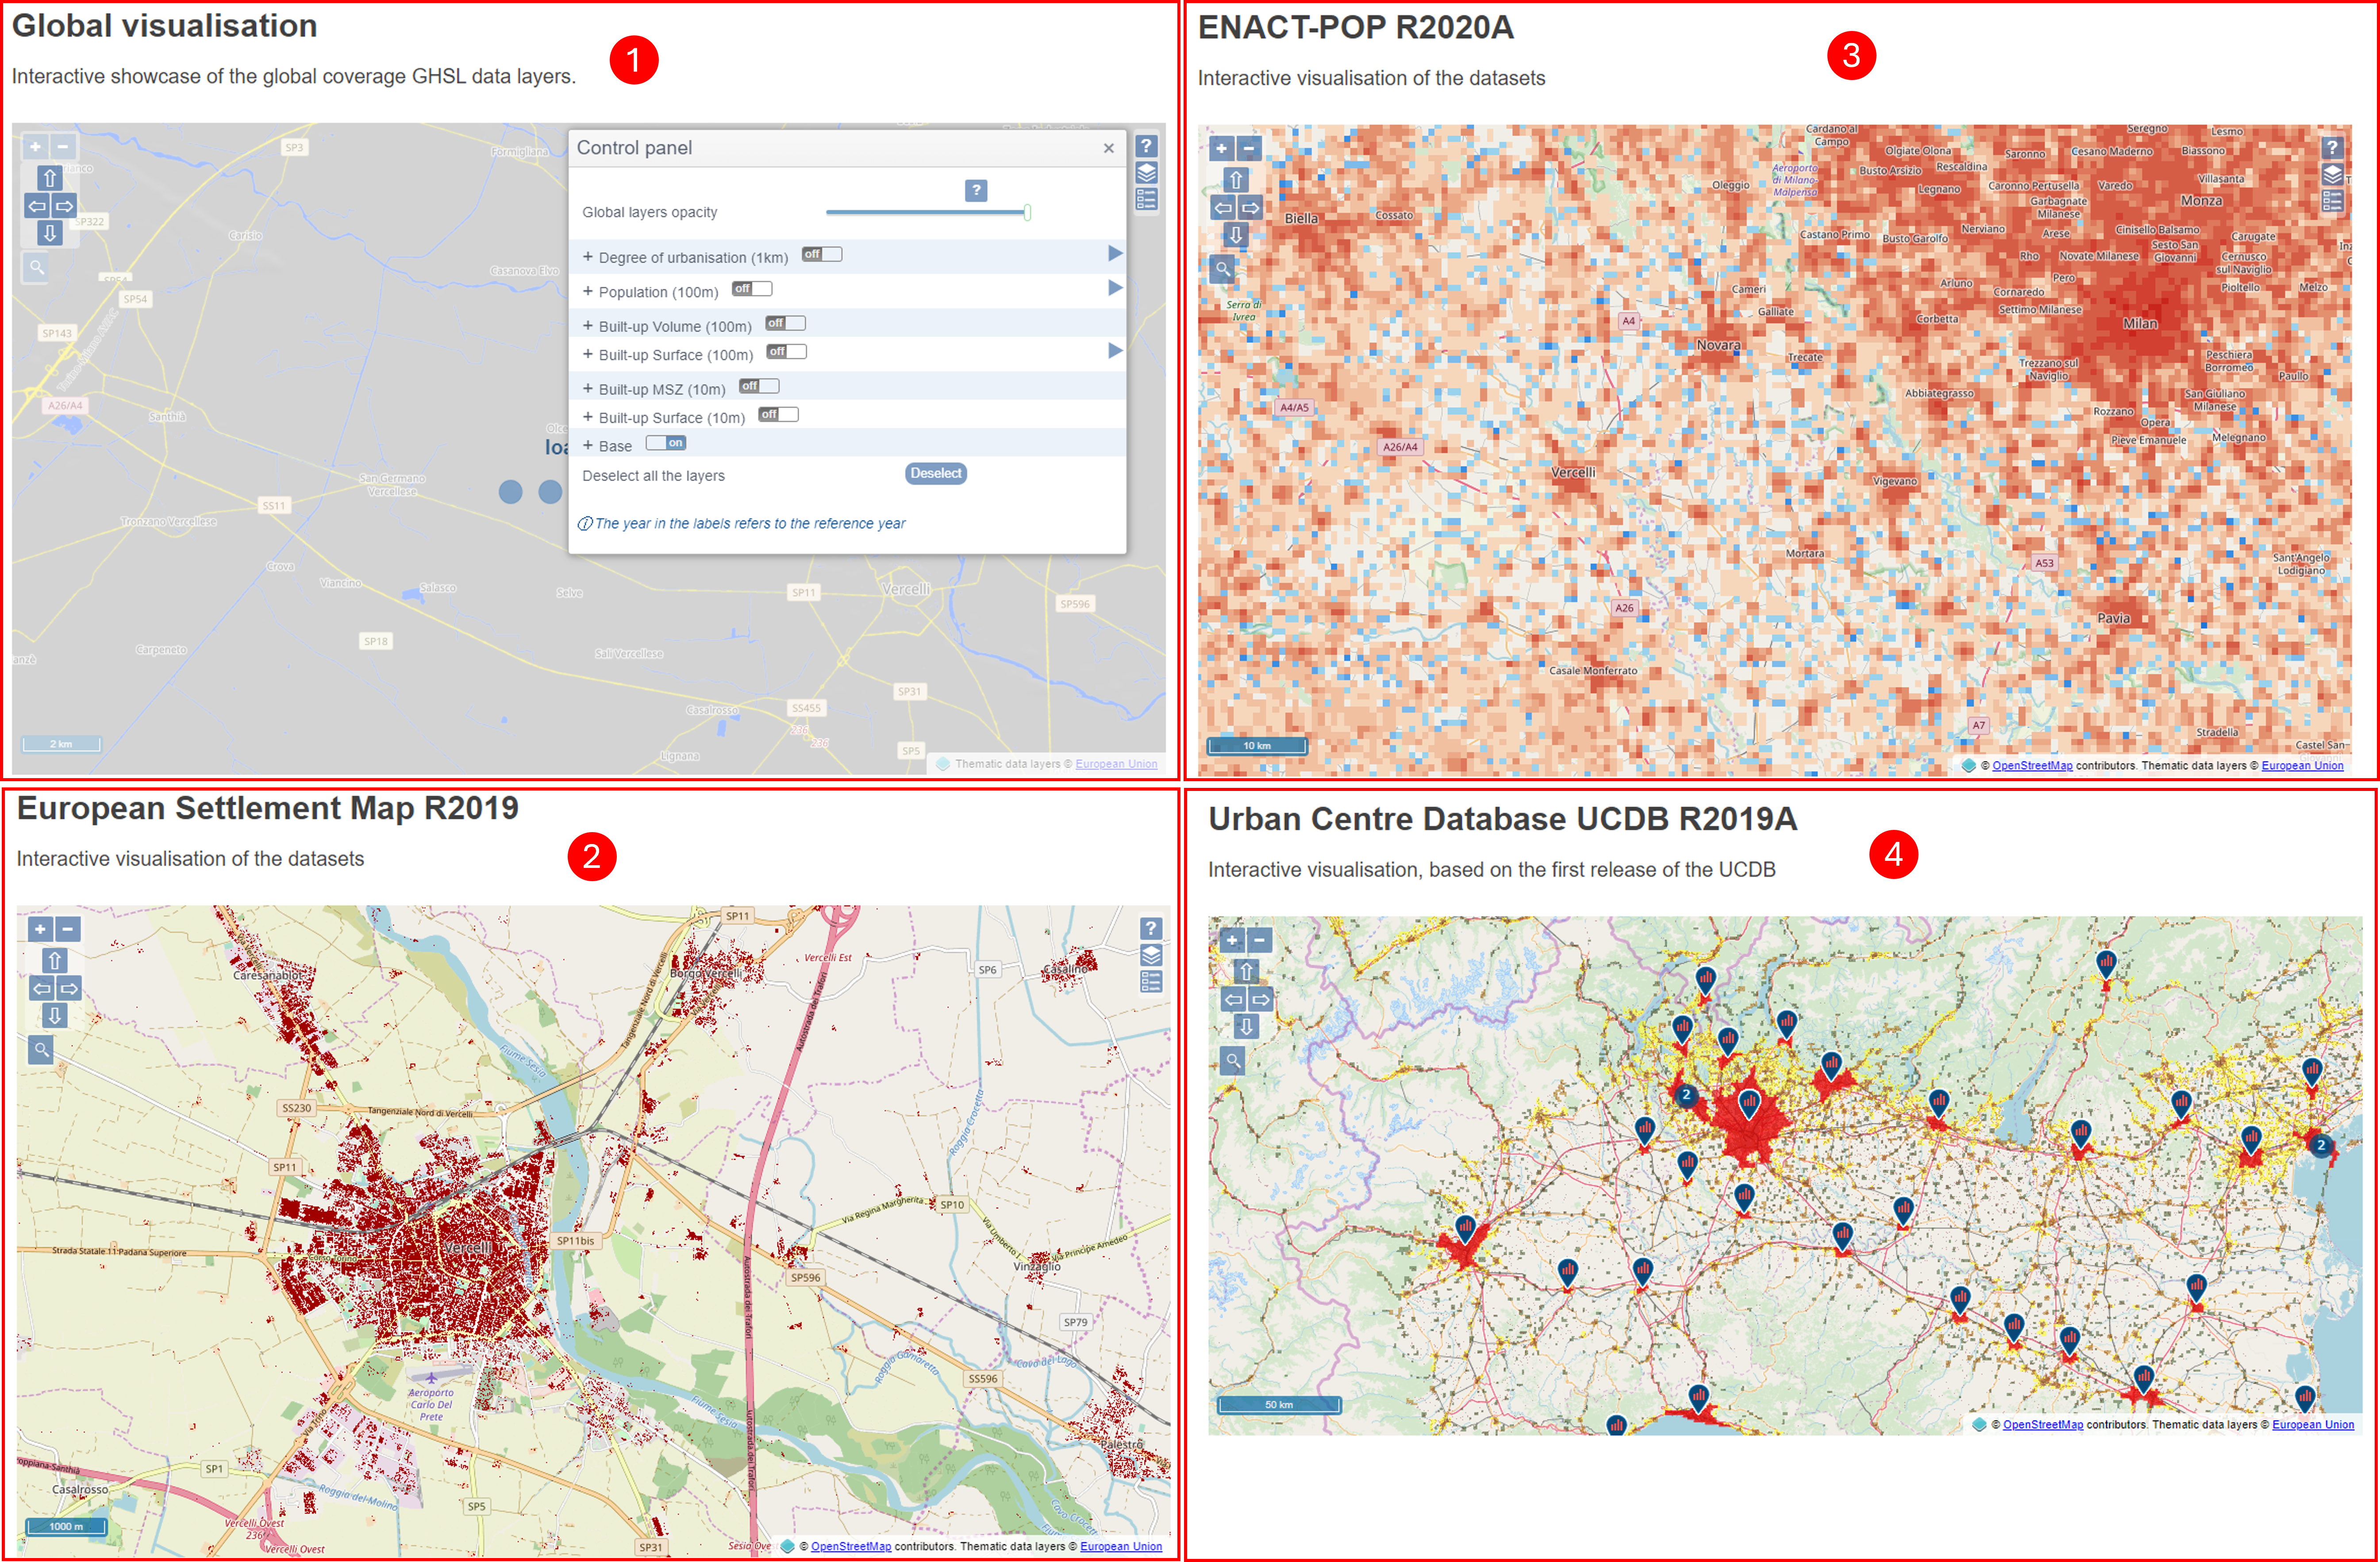
Fig. 6.1.13 – GHSL website - Visual analytics - maps
Clicking on Degree of Urbanisation (1) (Fig. 6.1.14) will open a page from which it is possible to open other pages, each dedicated to a different resource with the common topic of the degree of urbanization. The same pages can be reached from the drop-down menu of the Degree of Urbanisation button. The “Why a Global Definition?” page explains the importance of having a global, people-based definition of cities, urban and rural areas. Other than being a request inside the 2030 Agenda for Sustainable Development, it is explained that there are many benefits to having a harmonized method. In particular, the proposed method utilises three classes to classify the territory: cities, towns, semi-dense areas and rural areas. Examples of the benefits of this classification are the capability of aggregating data collections, allowing to capture the urban-rural continuum and reducing the distortions created by the variable size of statistical and administrative units (this is because the proposed method is based on a population grid). With this method, it is also possible to directly capture the people’s concentration instead of retrieving it indirectly from other data such as the built-up areas. The Definition page, also called Settlement classification in the drop-down menu, shows examples of classification explaining the adapted thresholds.
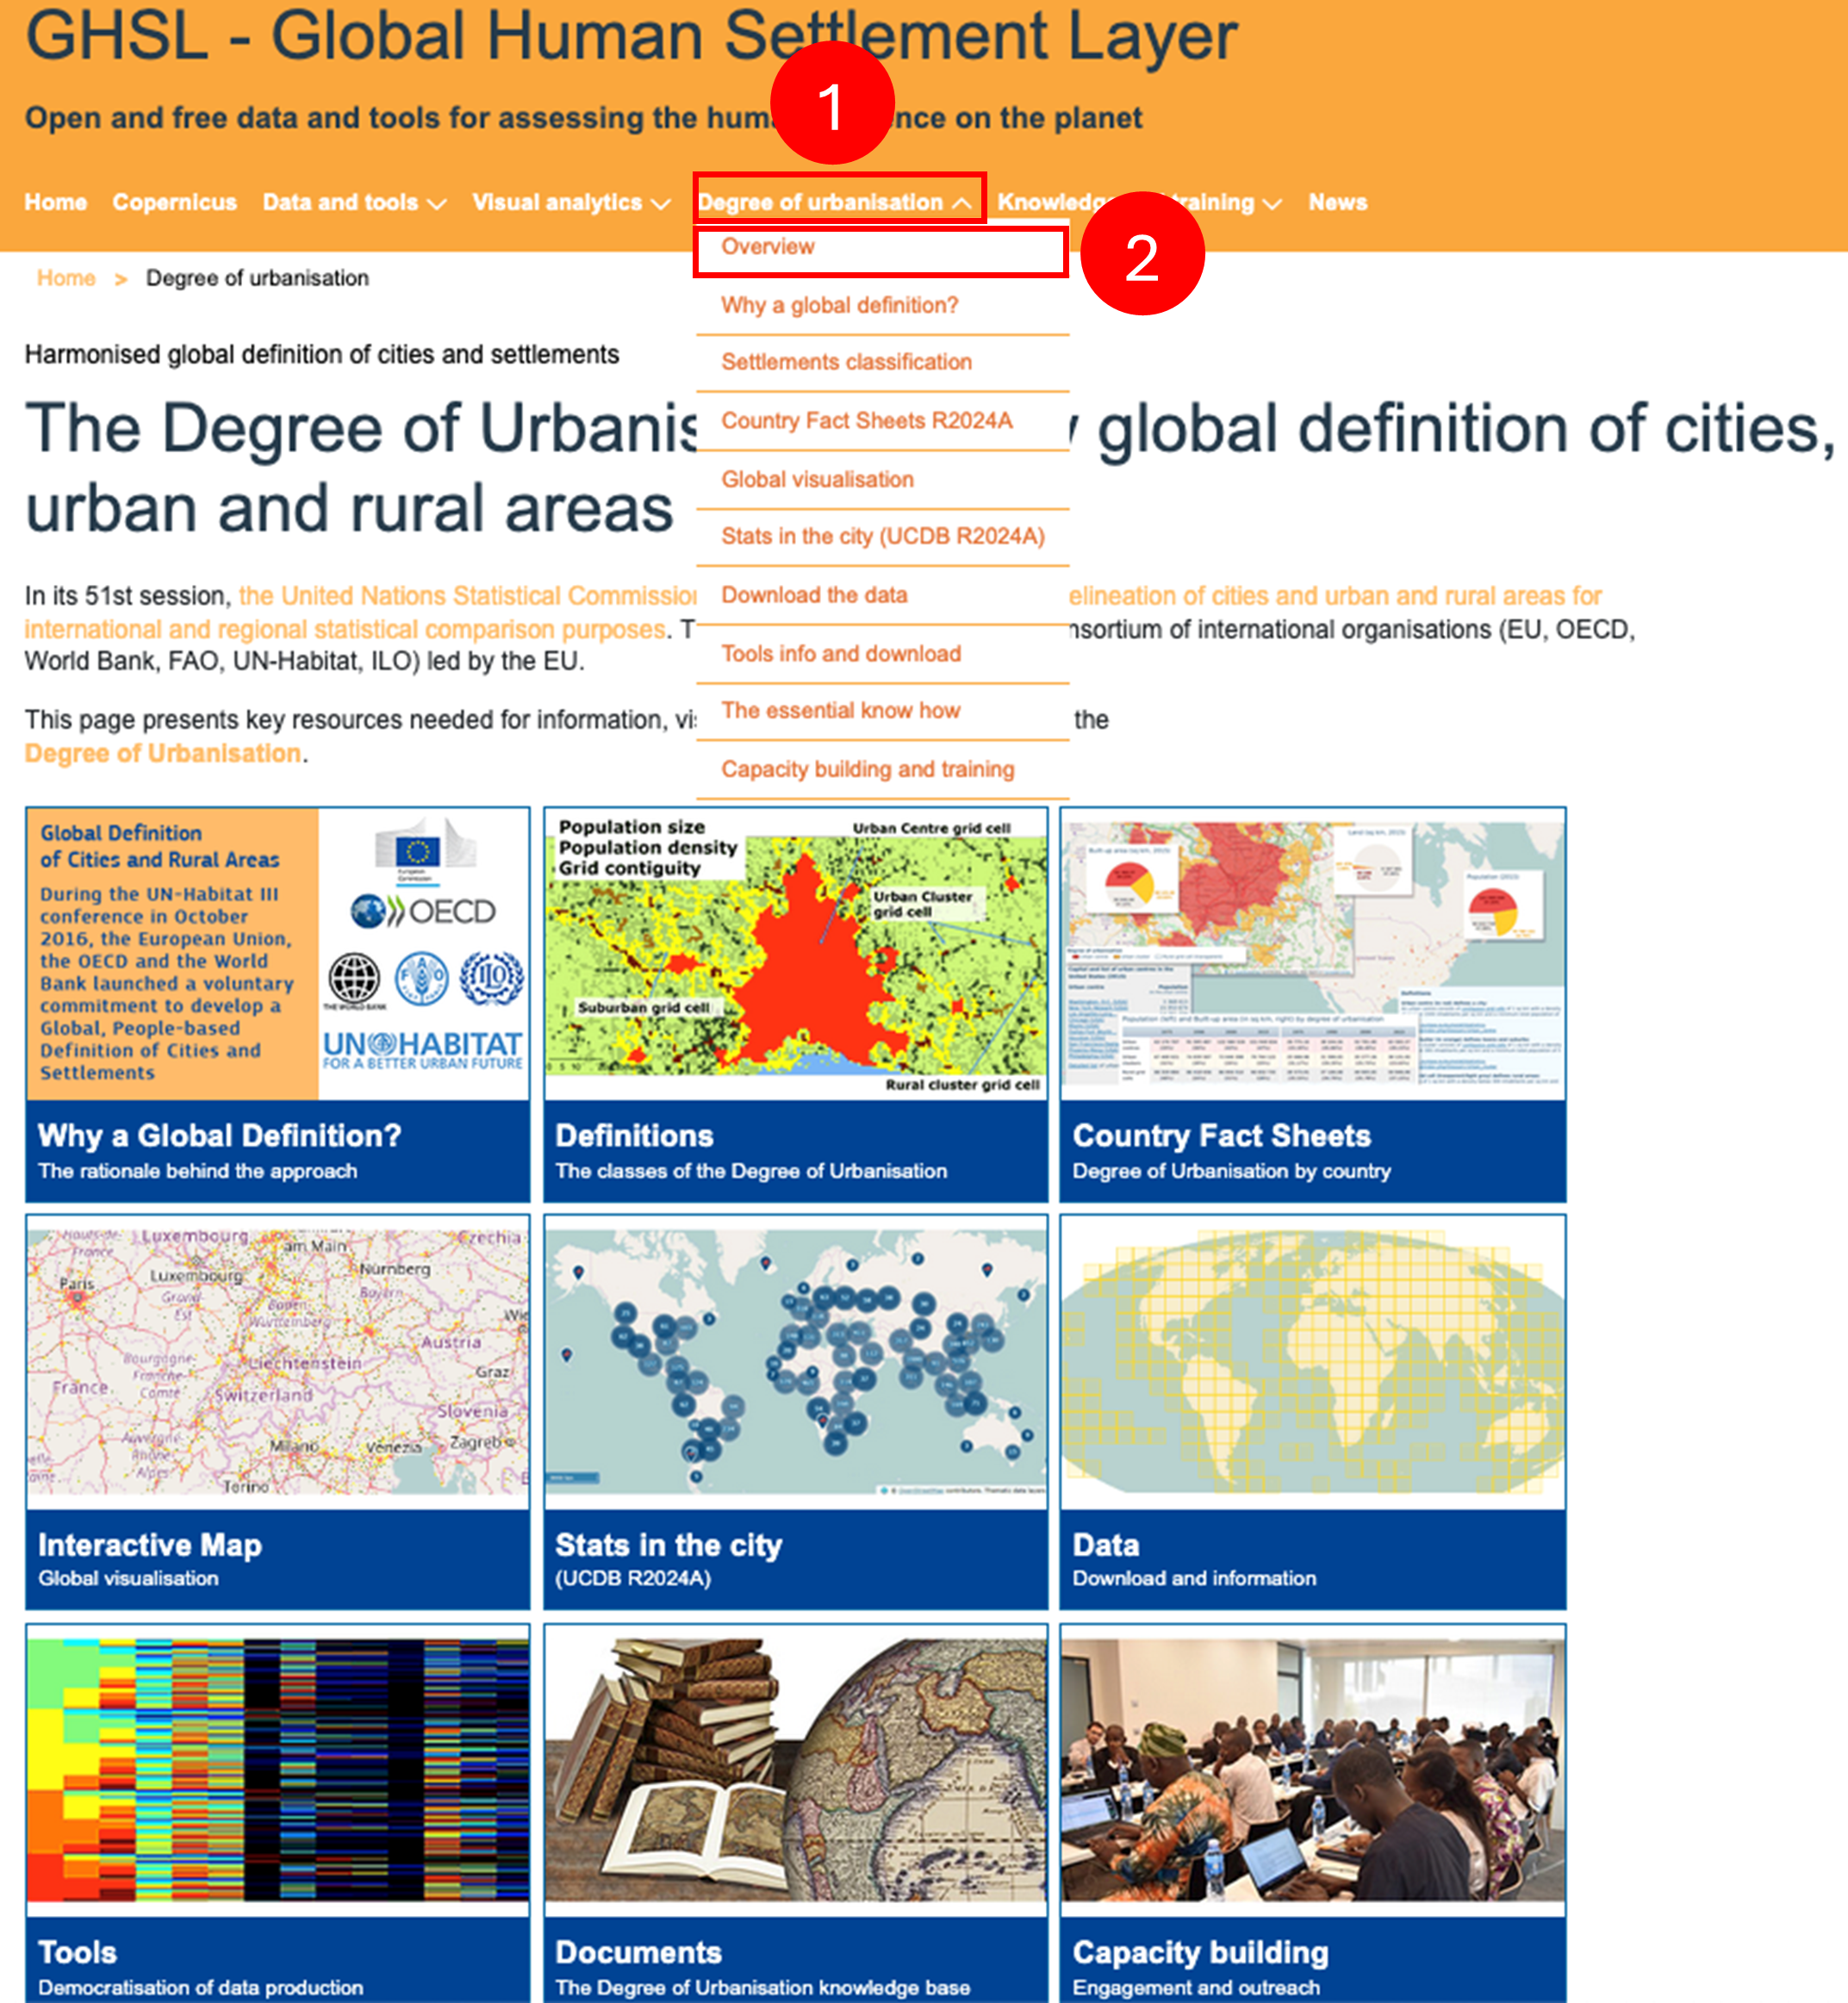
Fig. 6.1.14 – GHSL website - Degree of urbanisation
From the Country Fact Sheets page (1) (Fig. 6.1.15) , it is possible to select the country we are interested in through a drop-down menu (2). About the selected country is shown one or more maps of the Degree of urbanisation and a brief description explaining which was the process and data used to assess it.
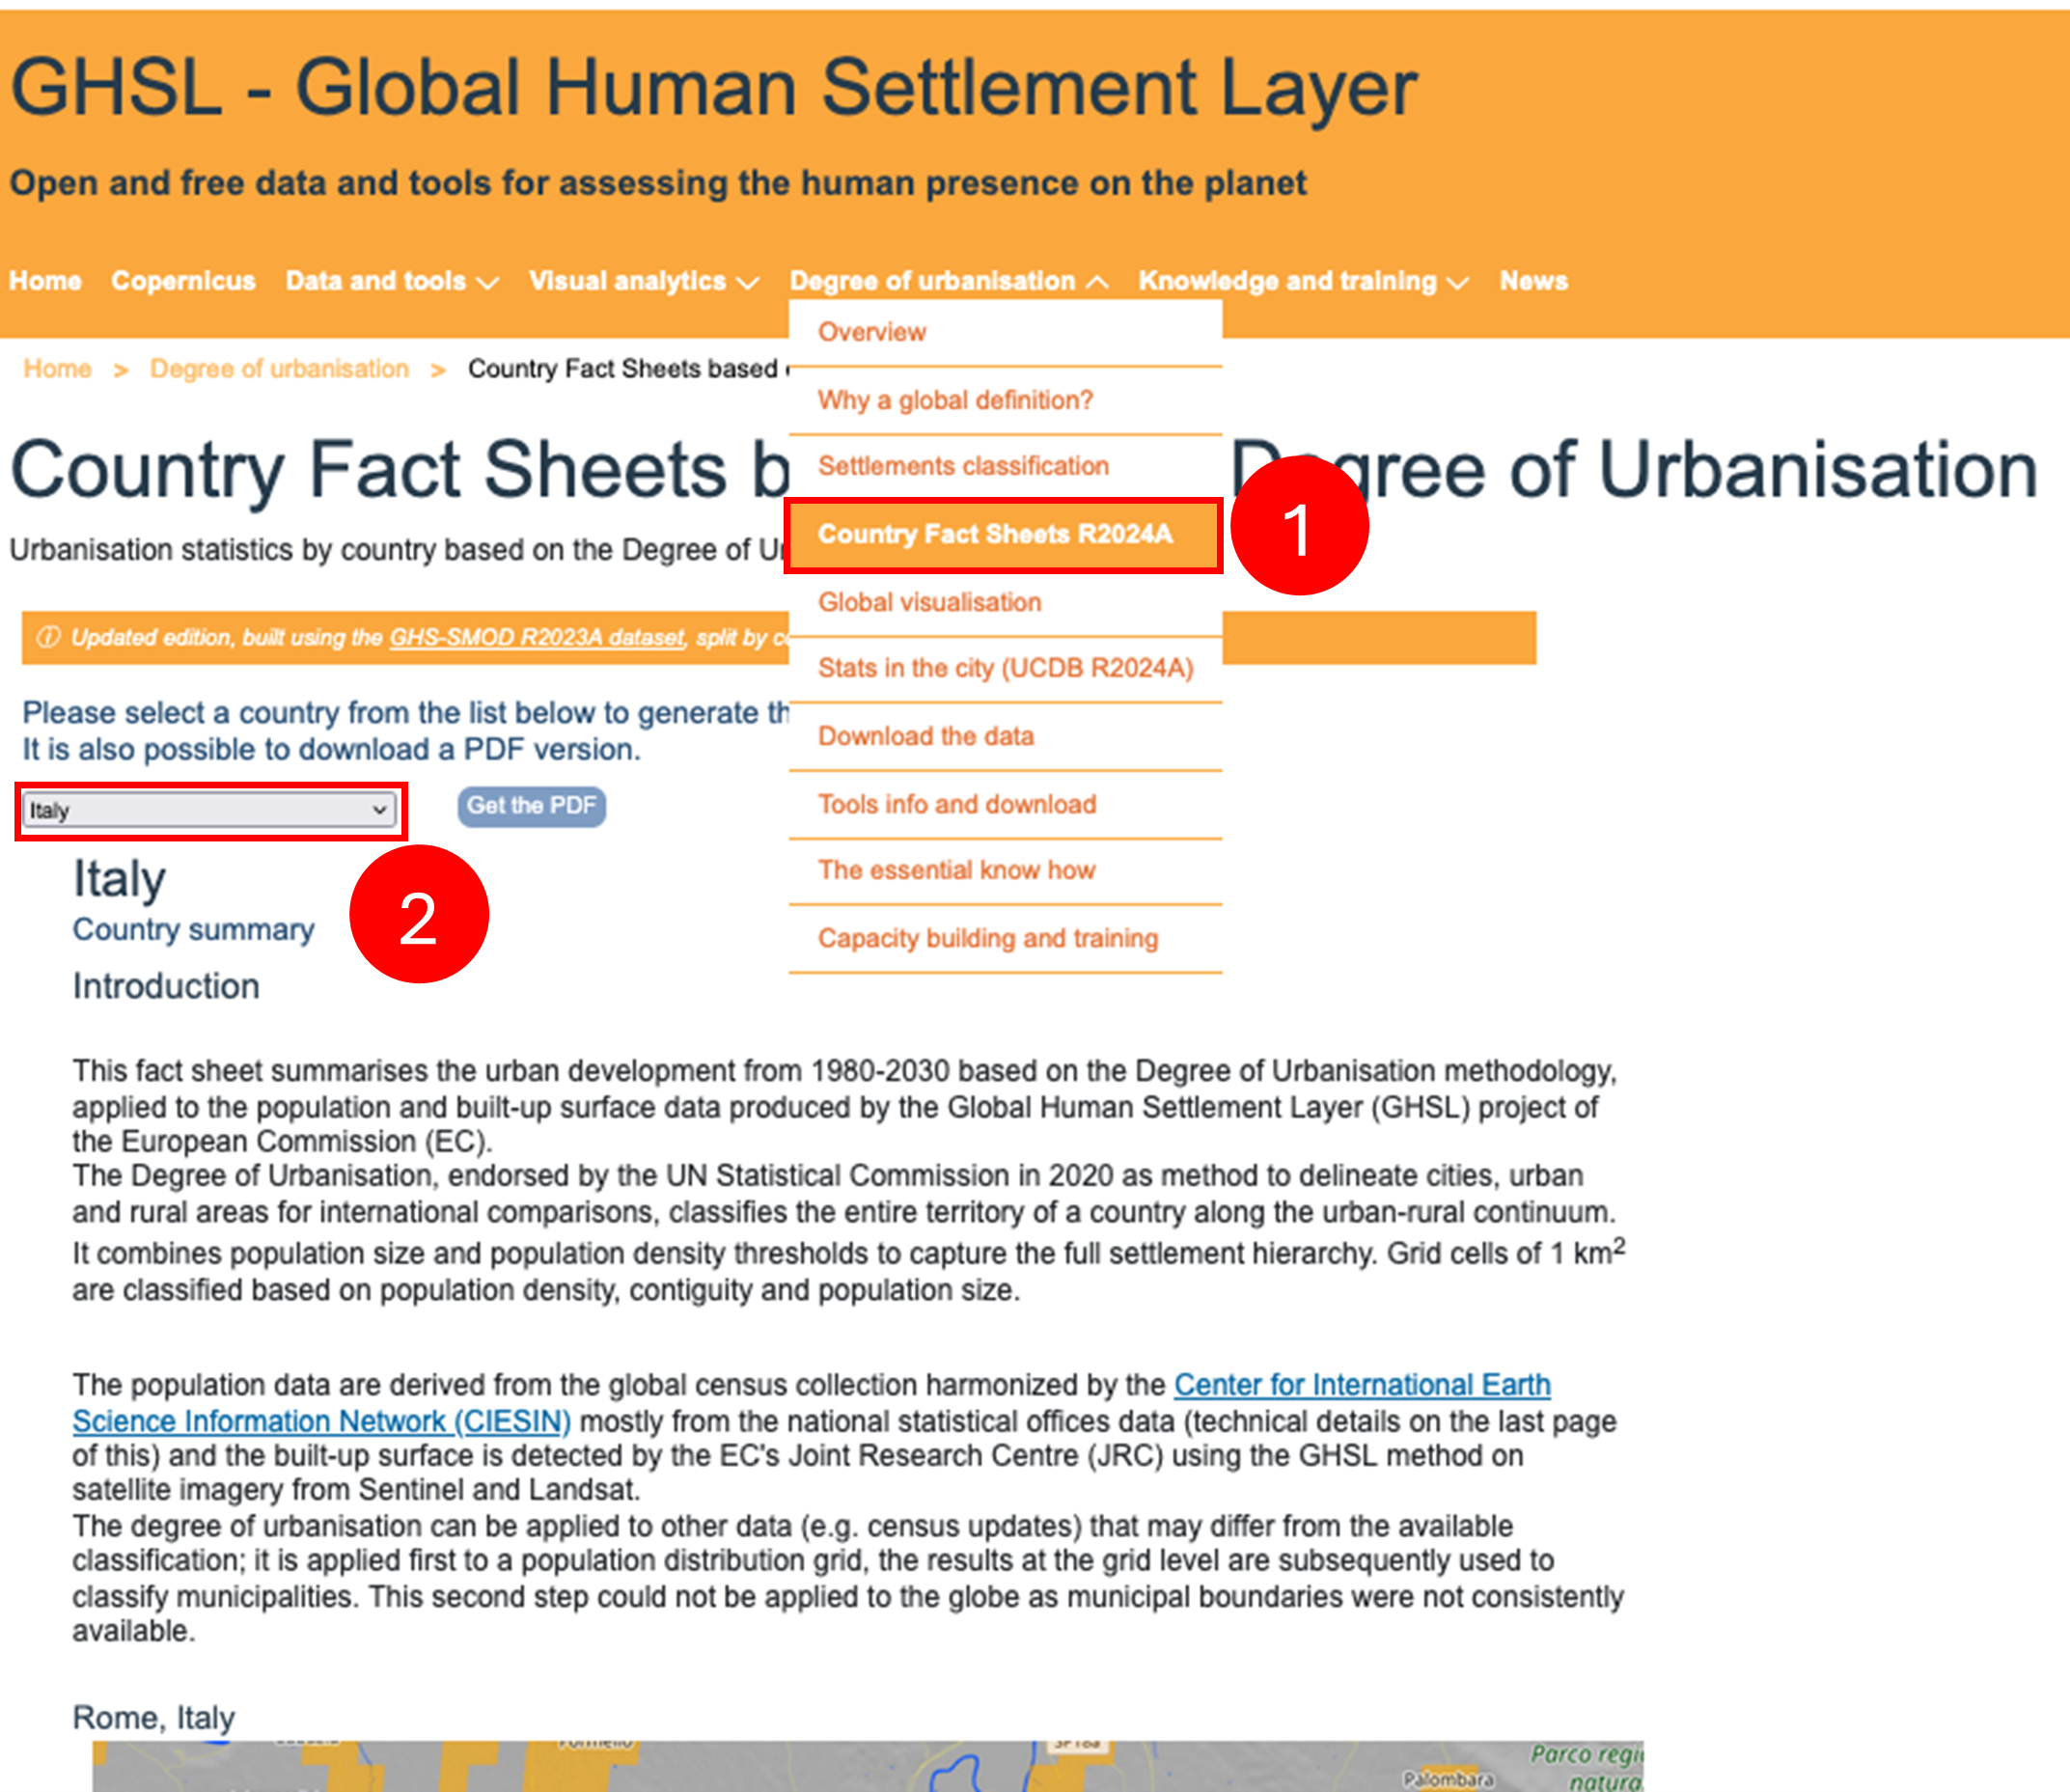
Fig. 6.1.15 – GHSL website - Degree of urbanisation - Country Fact Sheets
The Stats in the City R2024A page (1) (Fig. 6.1.16), provides access to the page where the interactive map is located by clicking on the Urban Center Database link (2).

Fig. 6.1.16 – GHSL website - Degree of urbanisation – Stats in the city
The Stats in the City page (Fig. 6.1.17) , allows you to open an interactive map by clicking on image from which it is possible to visualize data and apply some filters over the population count. On this page, there is also a brief description of Urban Centre Database GHS-UCDB R2019A.
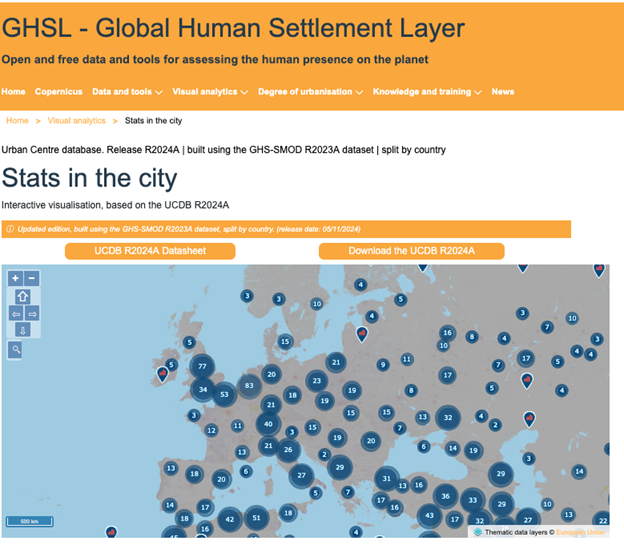
Fig. 6.1.17 – GHSL website - Degree of urbanisation - Urban Centre Database
The essential know how page (1) (Fig. 6.1.18) is composed of a series of links that lead to articles and papers useful to have a more in-depth understanding of the degree of urbanization and other related contents. Structured in a similar way, the Capacity building and training page (2), talks about the degree of urbanisation methodology addressing tools developed by GHSL, the target, the level of adoption by country and the adoption process.
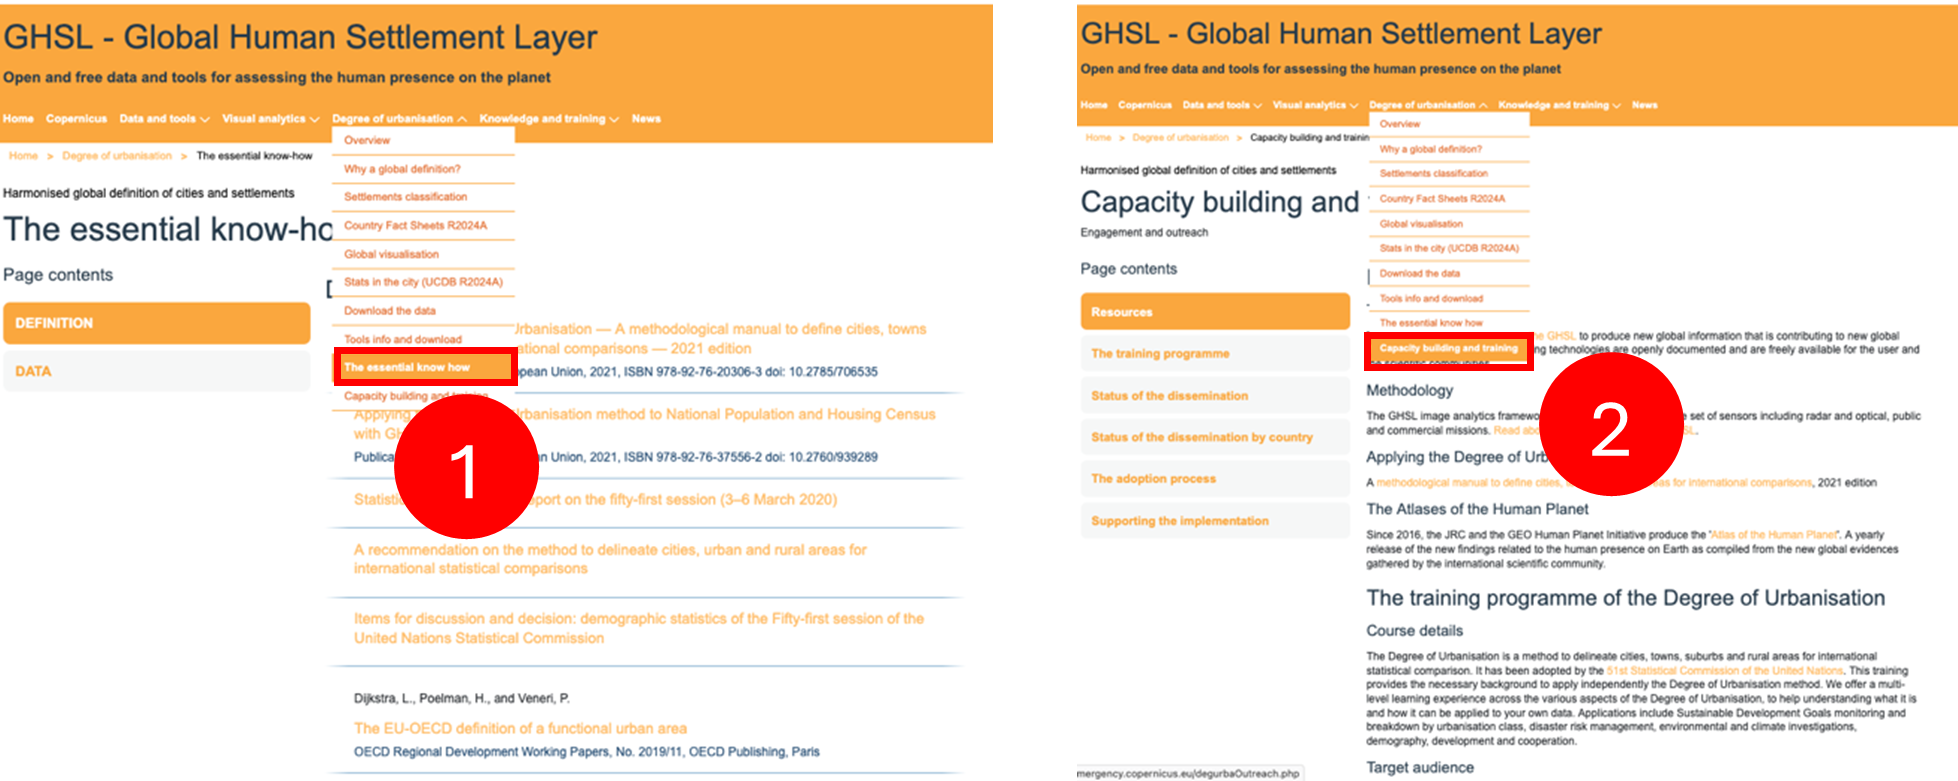
Fig. 6.1.18 – GHSL website - Degree of urbanisation - The essential know-how and Capacity building and training
Clicking on Knowledge and Training (1) (Fig. 6.1.19) will open a page providing information about the GHSL framework and the different level abstractions and how they are obtained. Clicking on About the GHSL (2) from the drop-down menu will open a page of information regarding GHSL in general, from the scope of the project to the description of the datasets and the partners of the project. Clicking on Documents (3) from the drop-down menu will open a page where an extensive list of papers can be consulted.
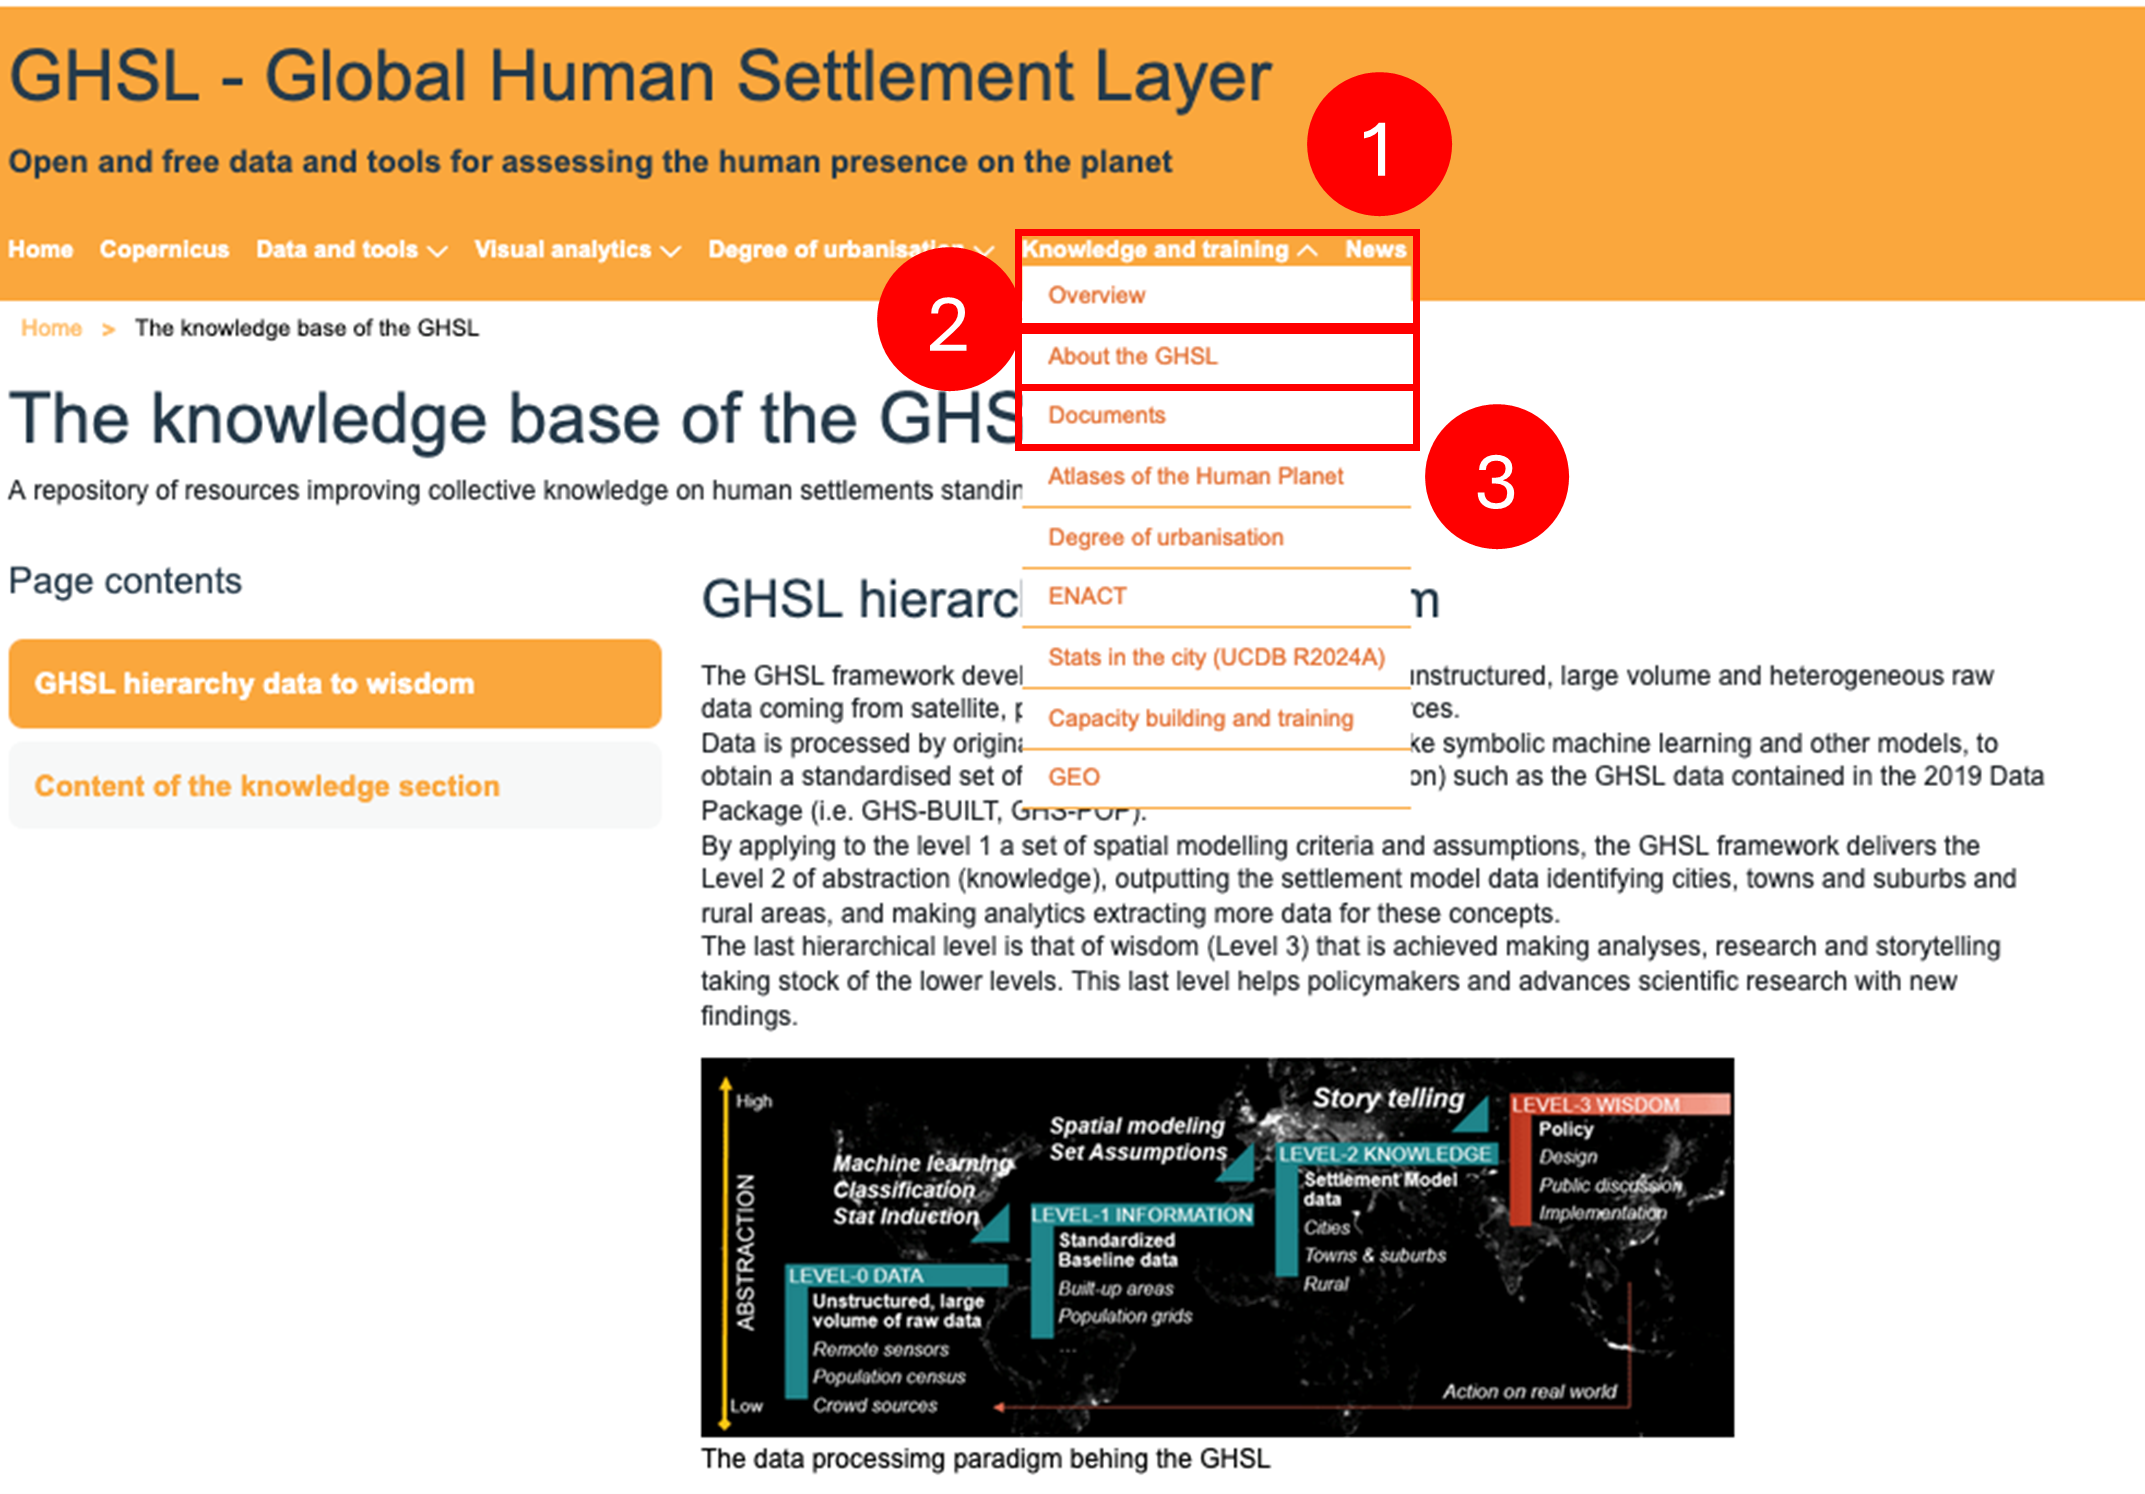
Fig. 6.1.19 – GHSL website - Knowledge and training - About the GHSL and Documents
The Atlases of the Human Planet page (1) (Fig. 6.1.20) talks about the common scope of the GEO Human Planet Initiative and the JRC of producing yearly atlases of the human planet. Each atlas highlights different aspects such as the human and physical exposure to threats, the impact of human activities on ecosystems etc. On this page are also reported links to each already produced atlas.
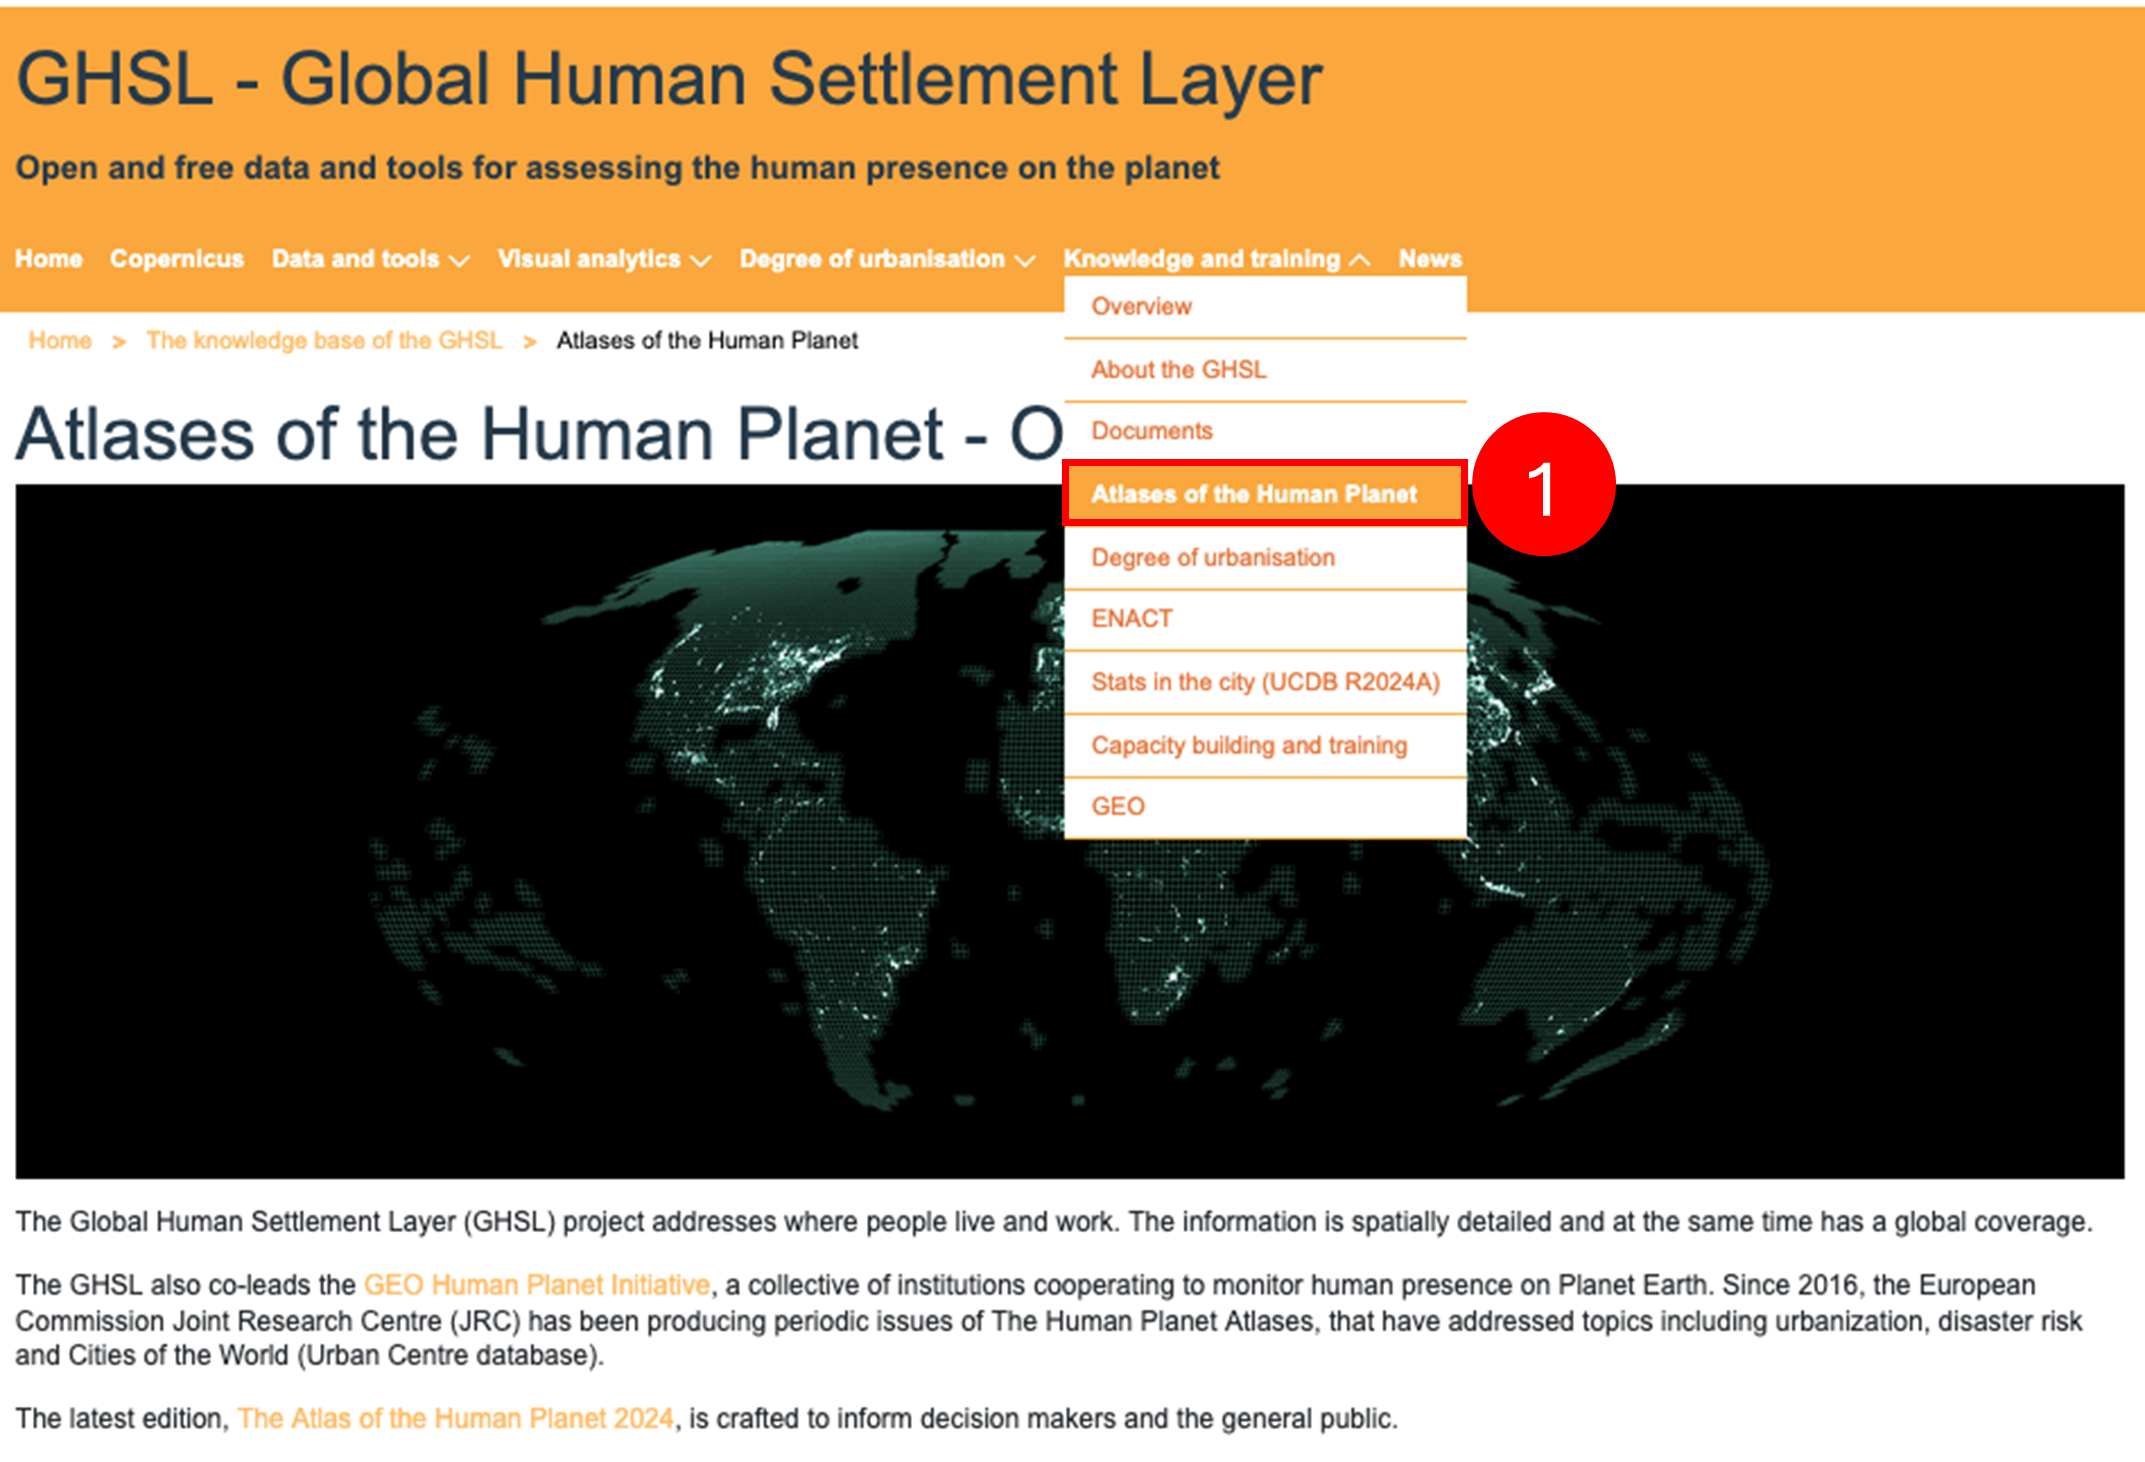
Fig. 6.1.20 – GHSL website - Knowledge and training - Atlases of the Human Planet
The ENACT (ENhancing ACTivity and population mapping) page (1) (Fig. 6.1.21) focuses on explaining the production and aim of developing consistent, seamless, and high-resolution population density grids for Europe, considering major daily and monthly variations. Having this kind of data could be useful for many applications such as the assessment of urban and regional planning, and policy support in various domains.
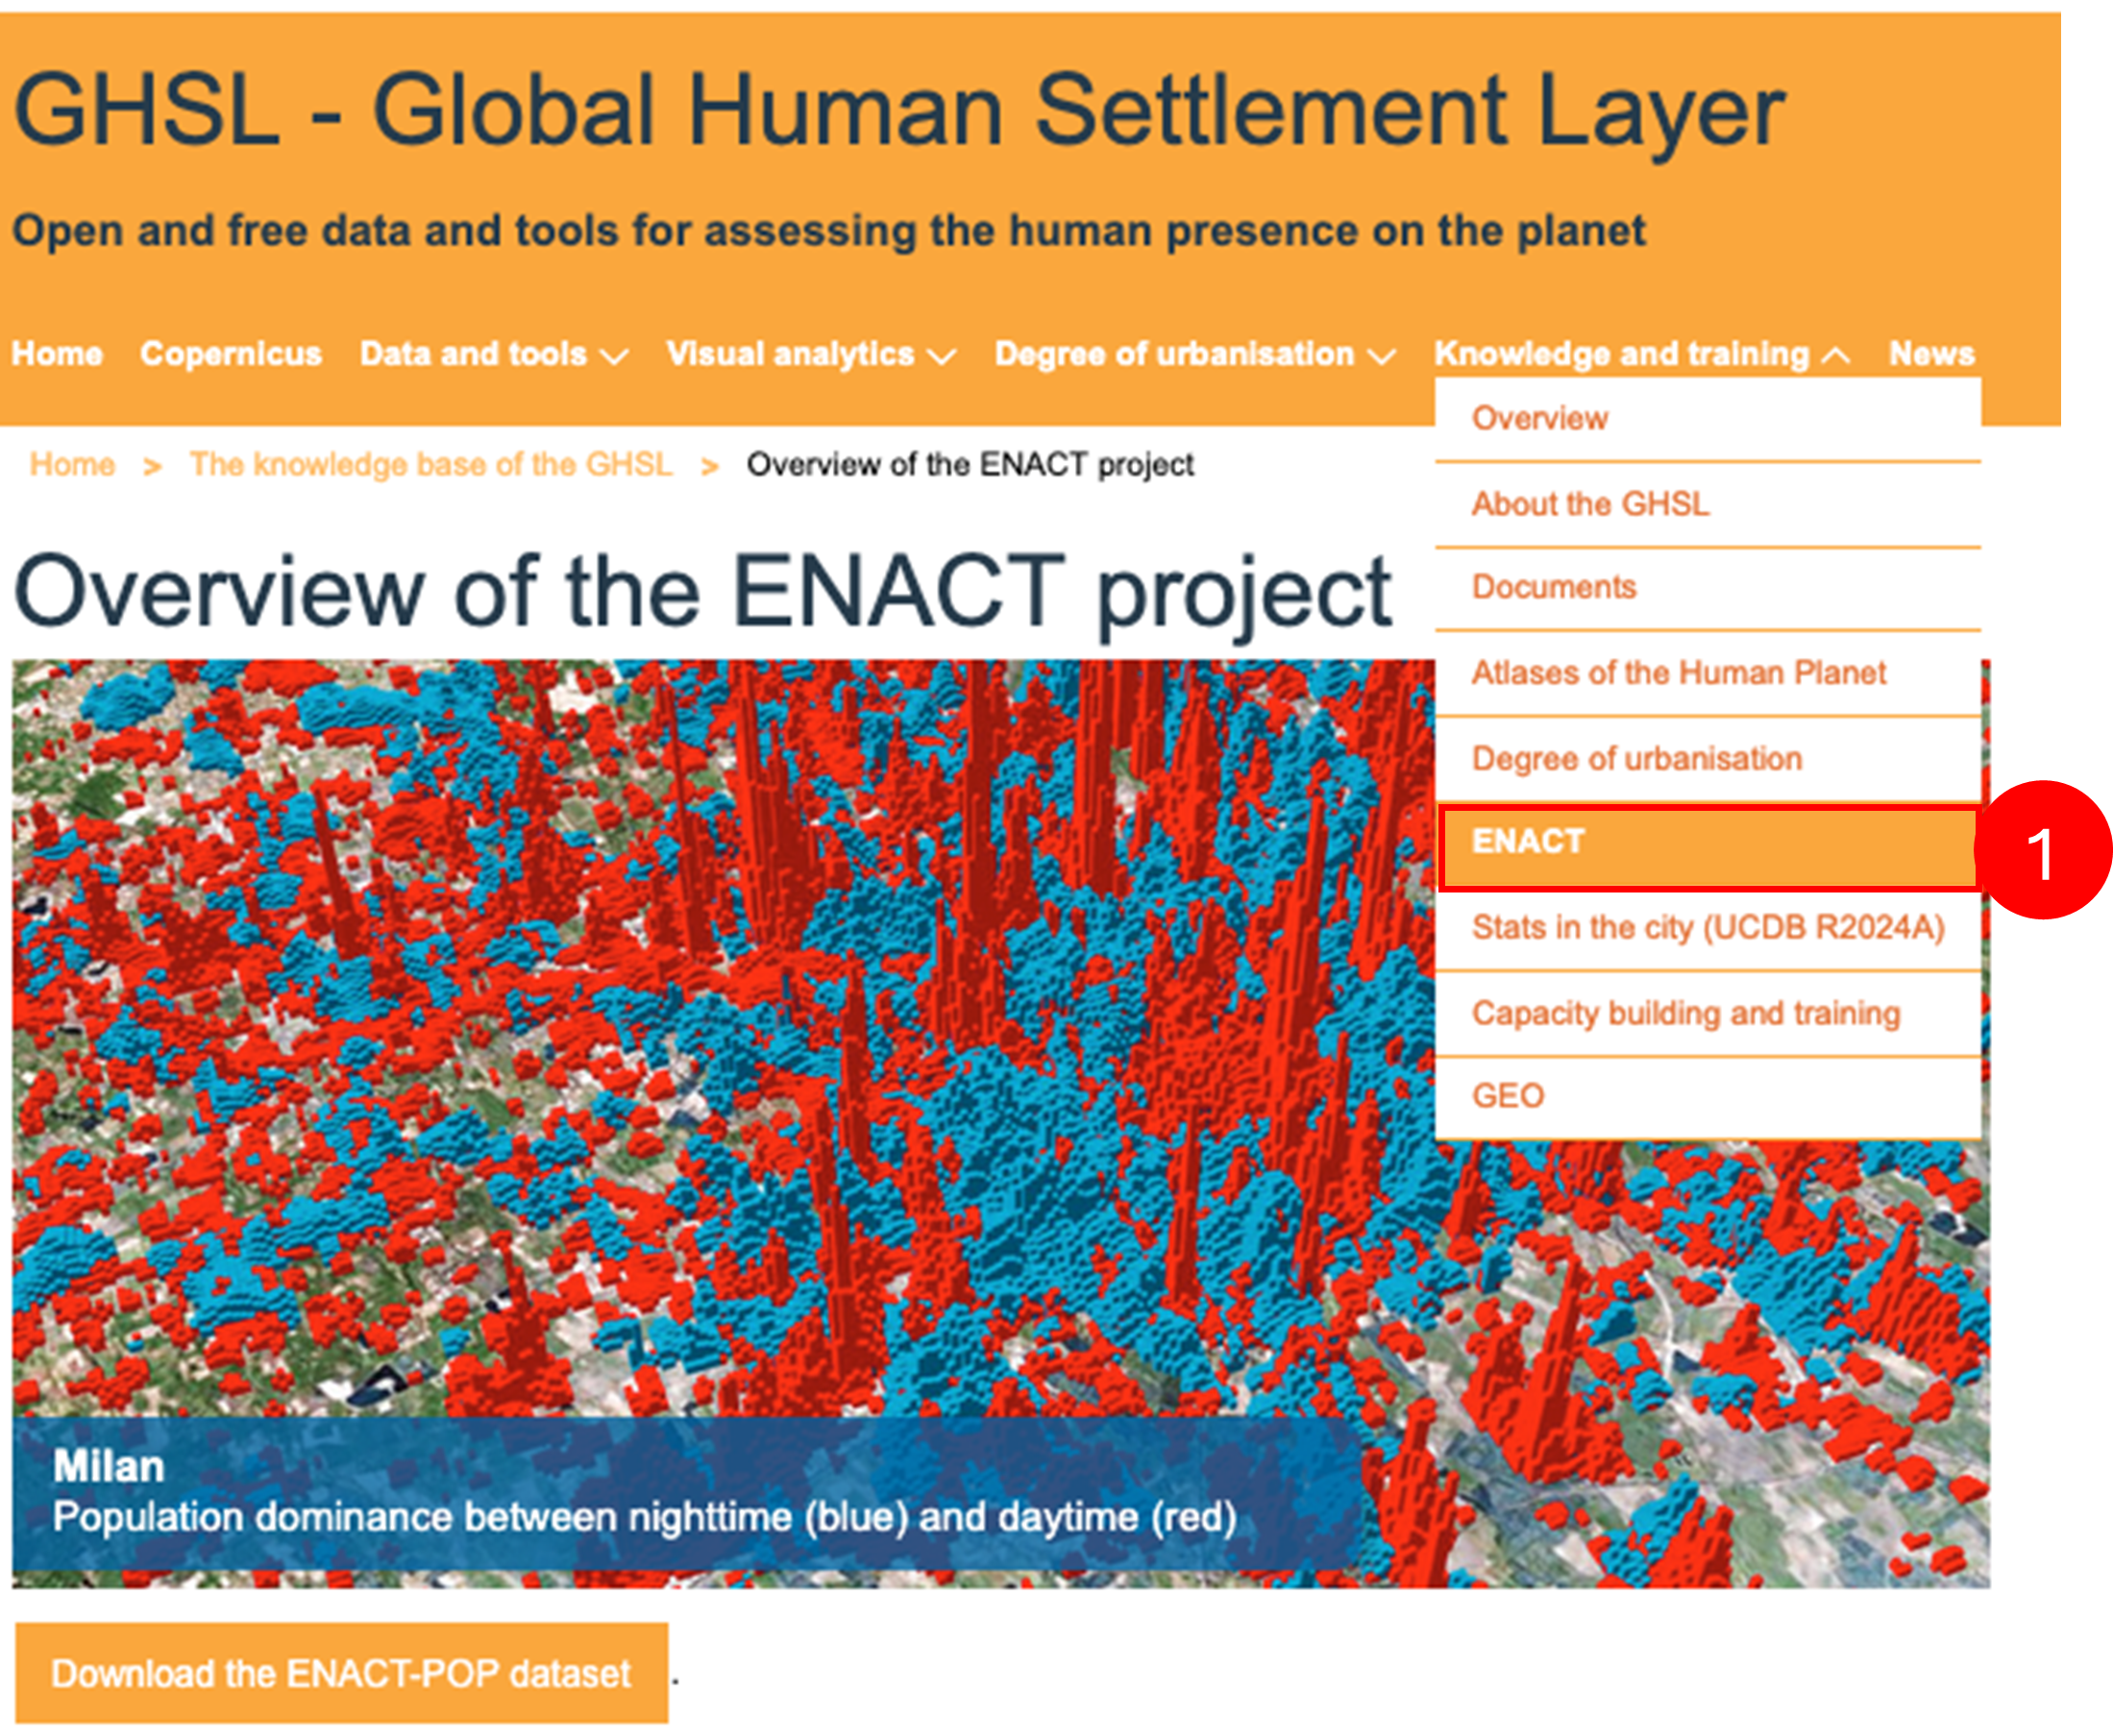
Fig. 6.1.21 – GHSL website - Knowledge and training - ENACT
The last page of the Knowledge and training section is called GEO (Group on Earth Observations) (1) (Fig. 6.1.22) . The GEO is a collaboration of organizations to develop solutions to global challenges. The main focus of this page is to talk about the Human Planet Initiative (HPI) which is an initiative of the GEO devoted to assessing the human impact on Earth using Earth observation technologies and geospatial data analytics.
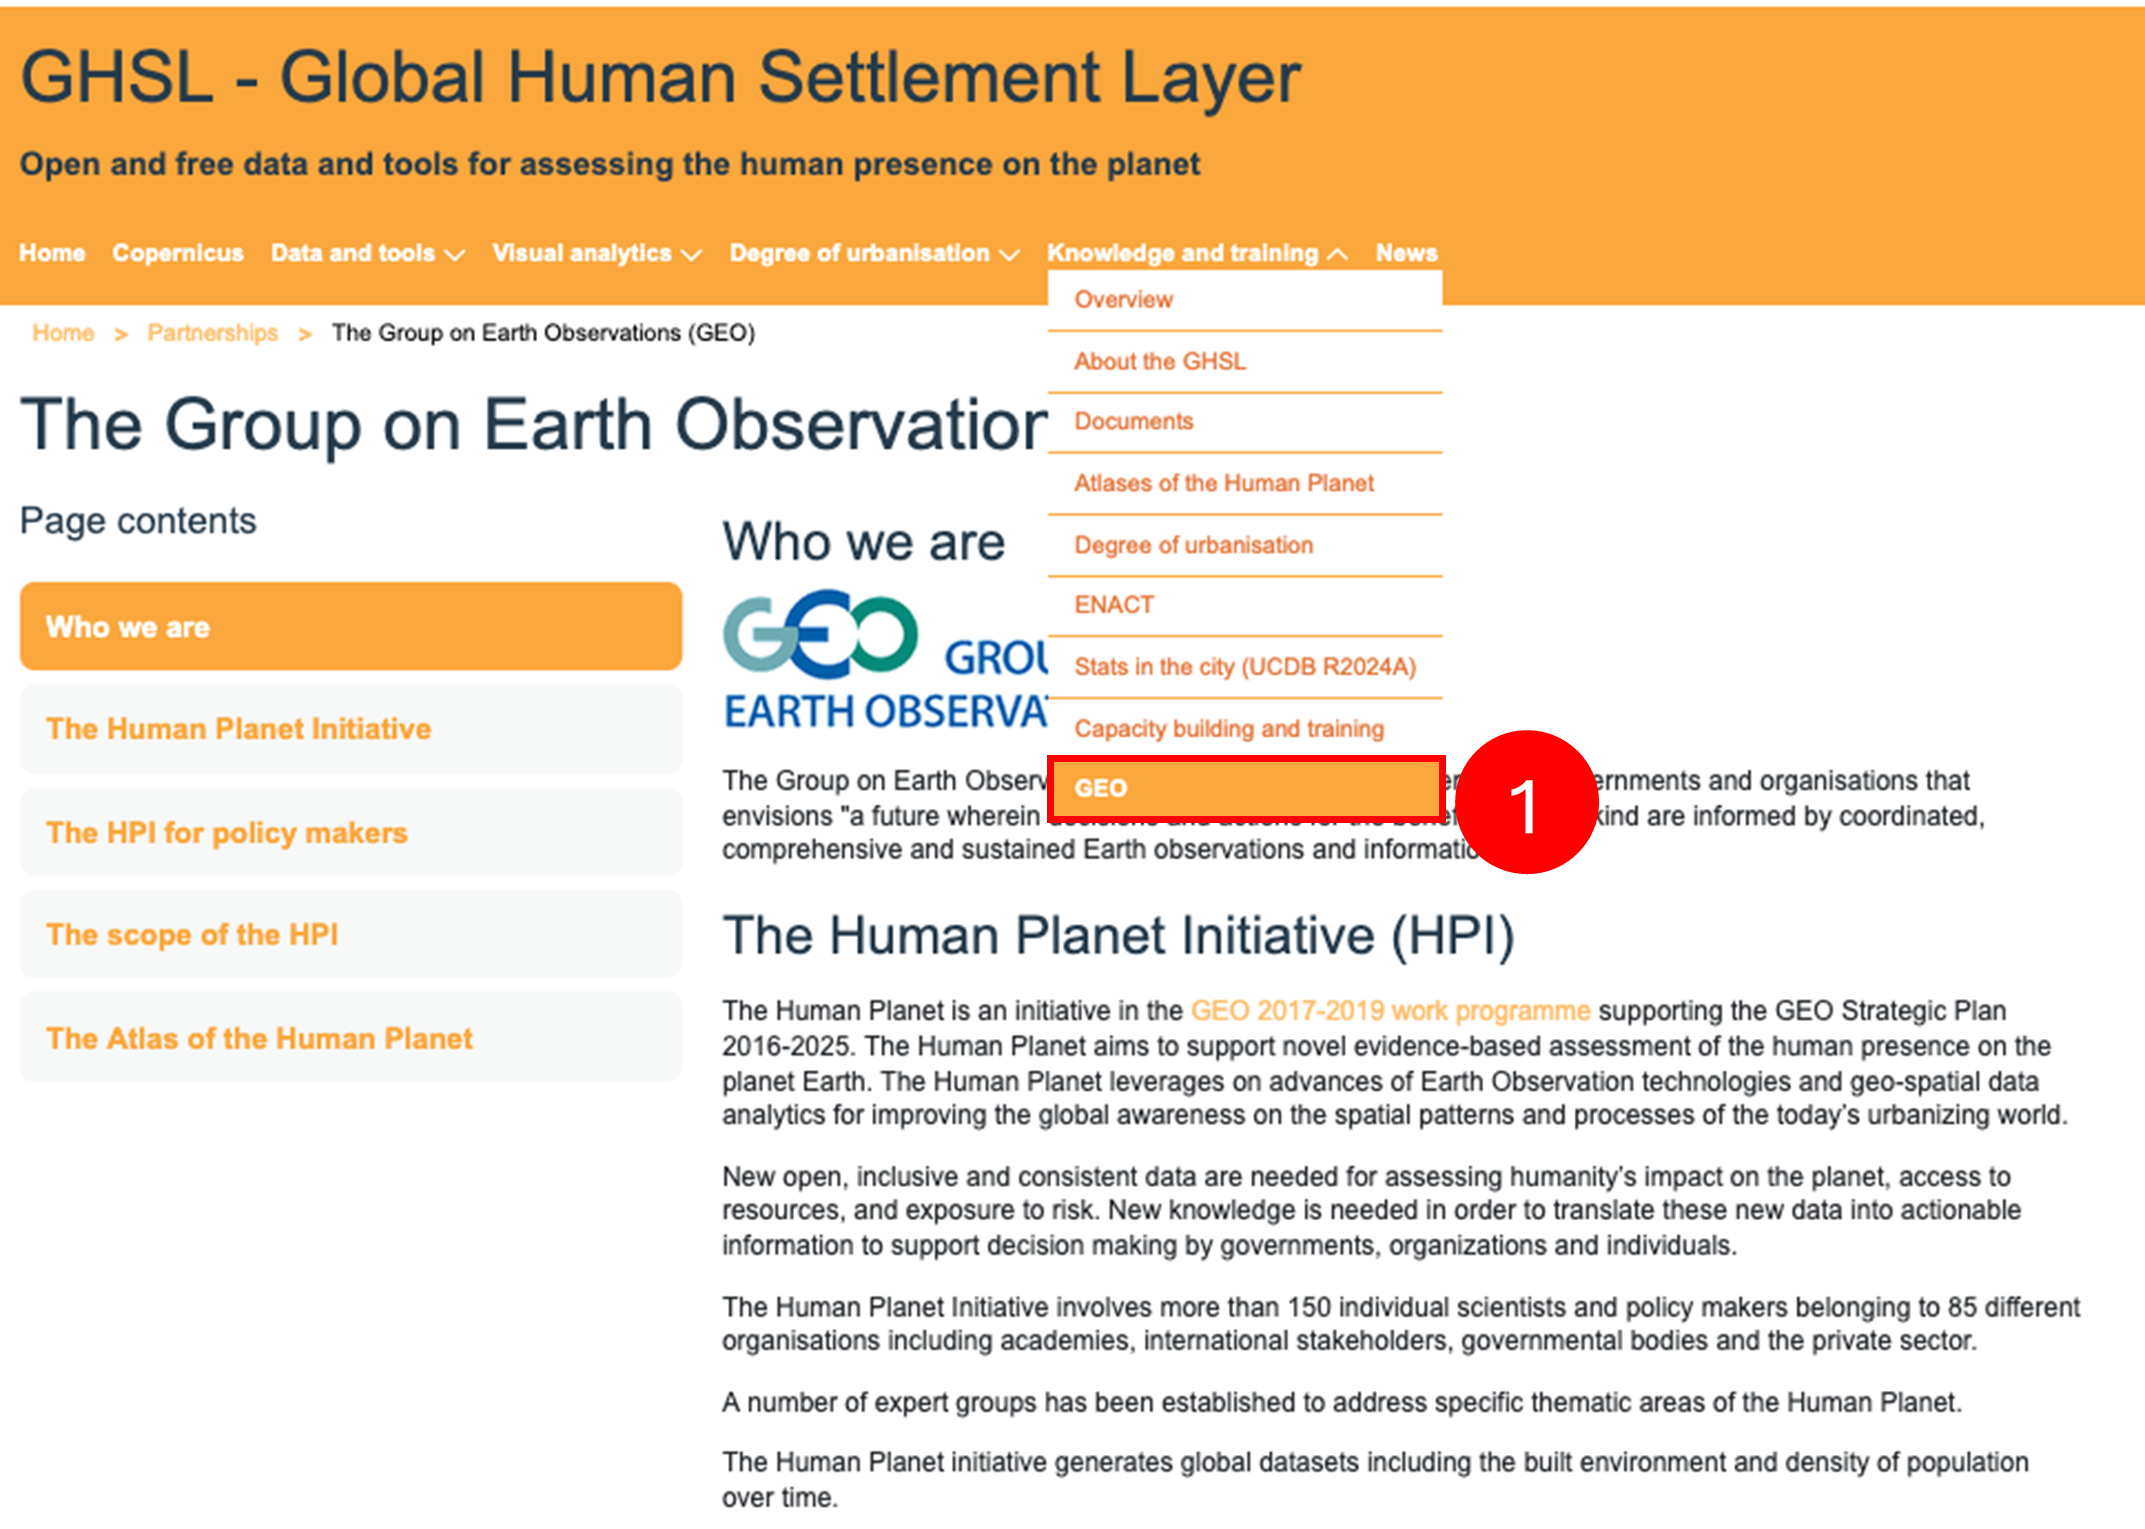
Fig. 6.1.22 – GHSL website - Knowledge and training - GEO
The last section of the website is represented by the News page (1) (Fig. 6.1.23) . On this page, there is a summary of all news, updates and events regarding GHSL.
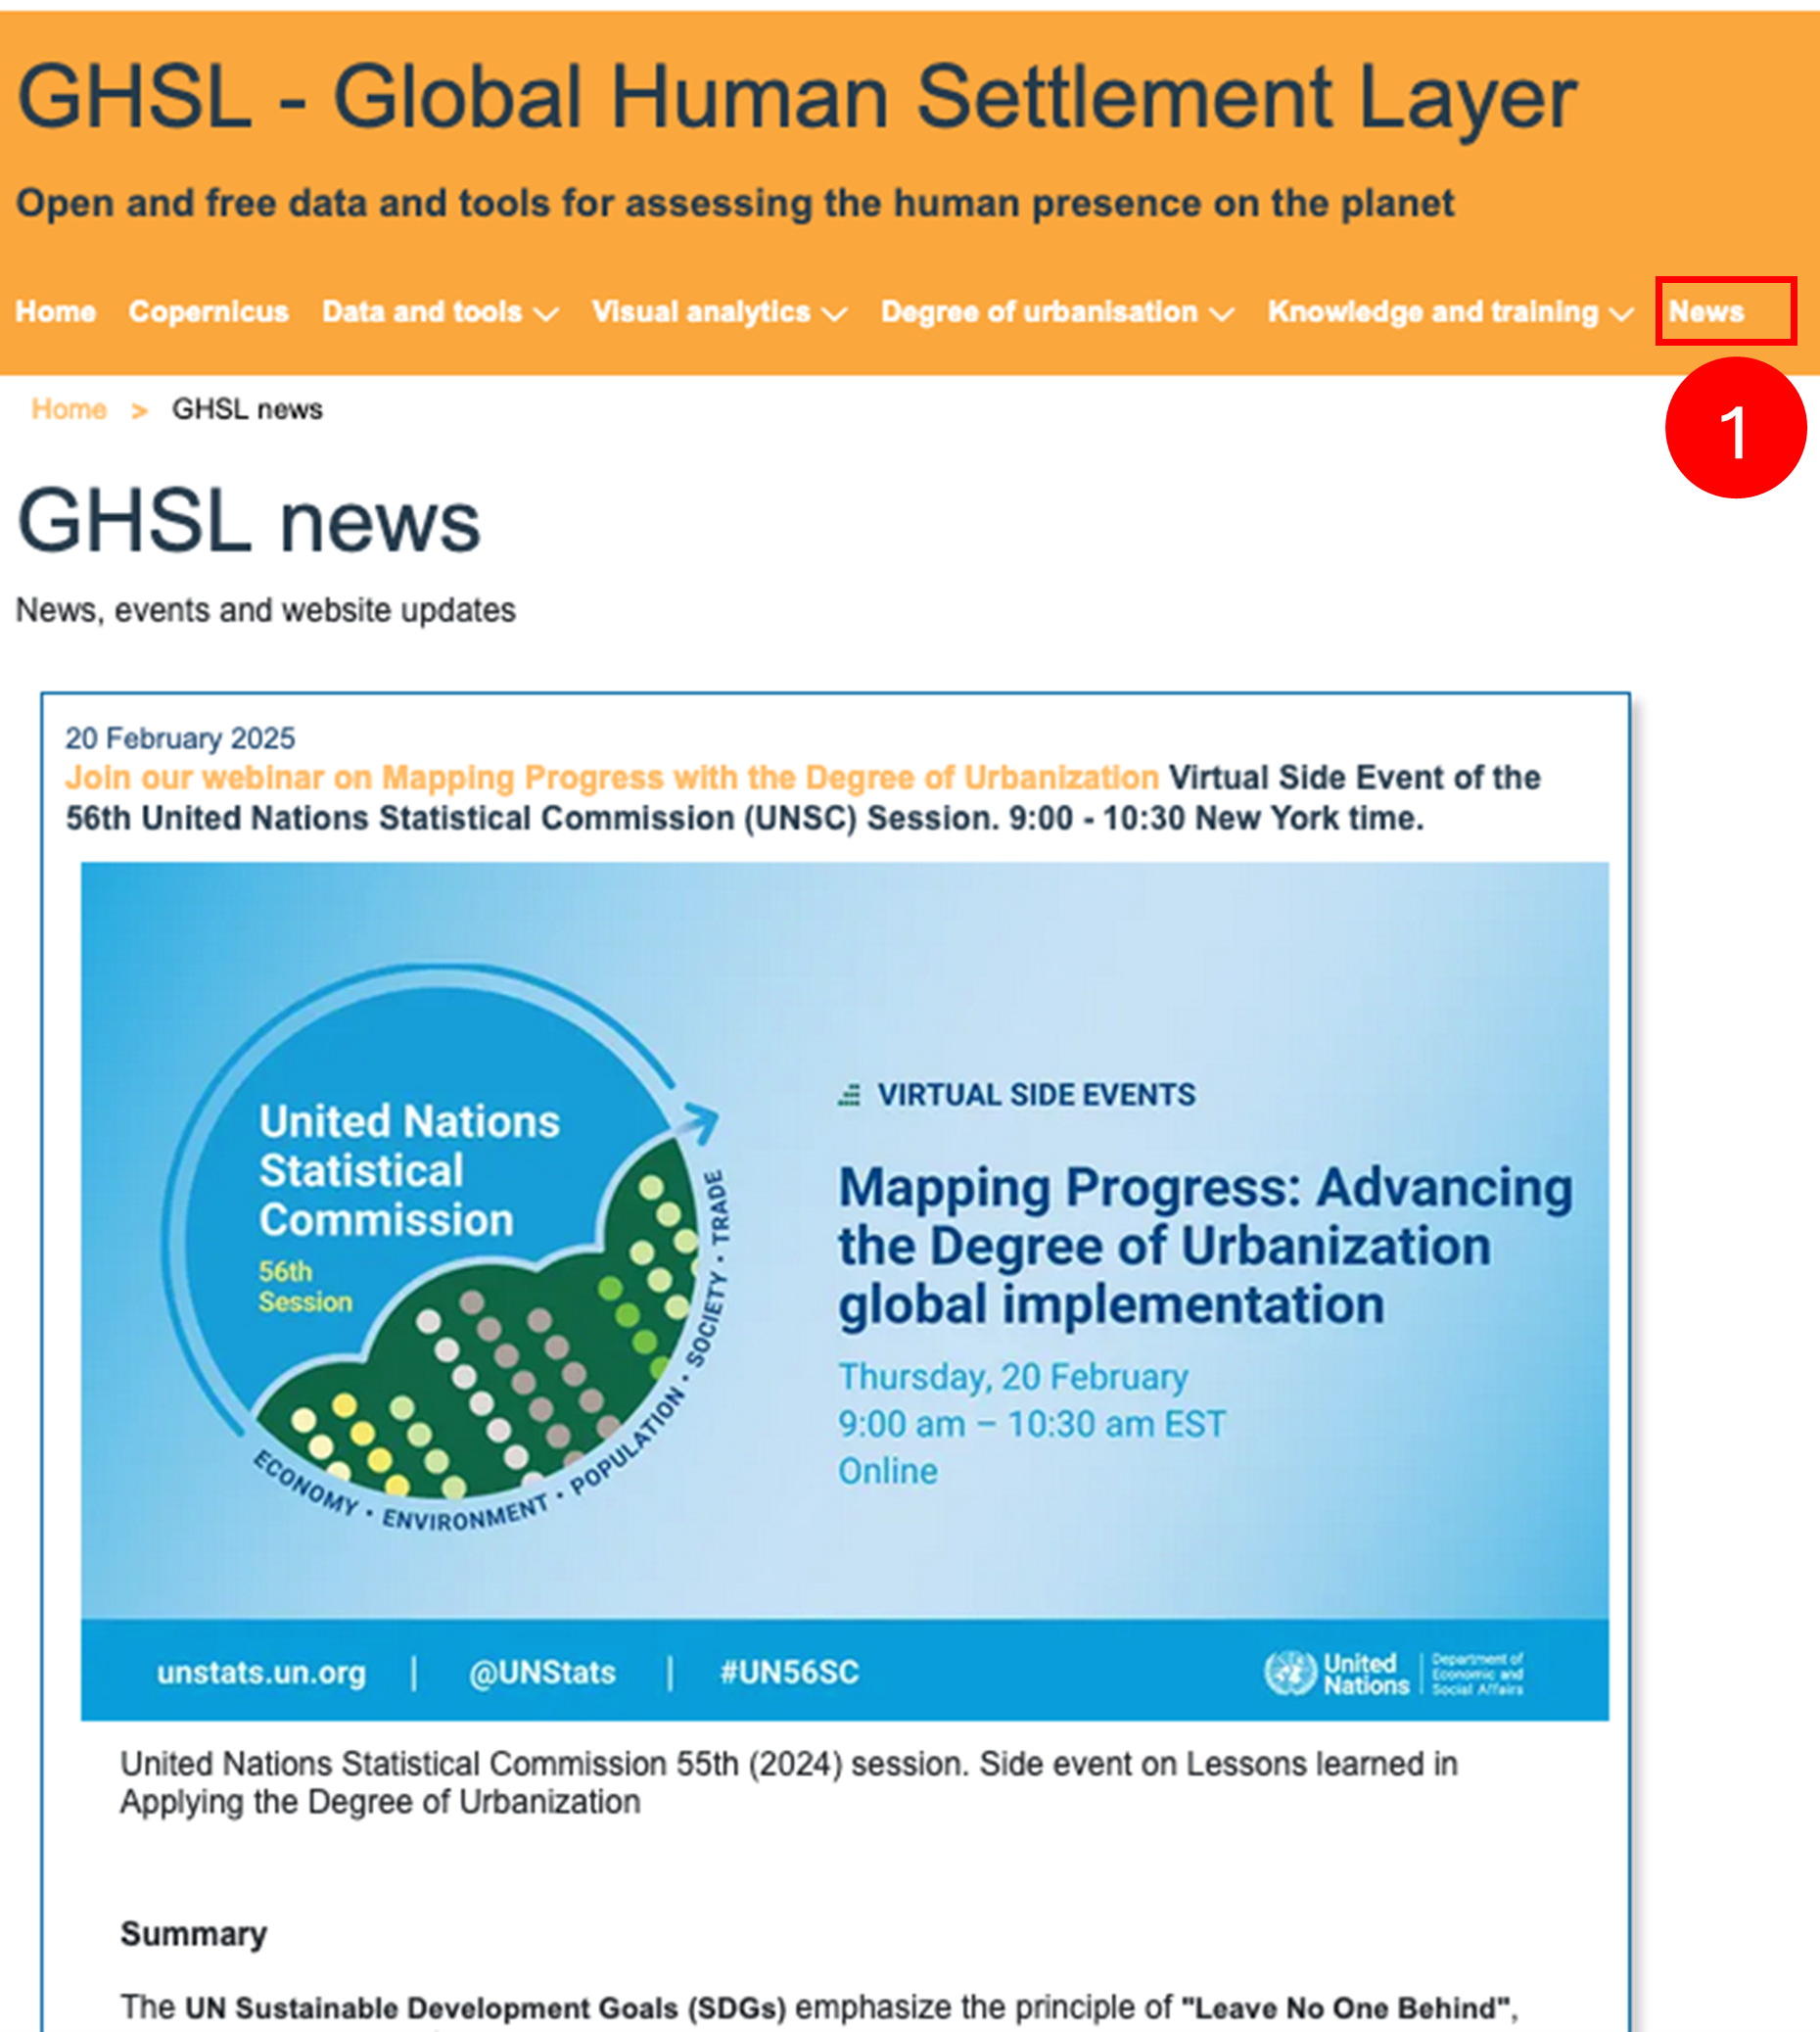
Fig. 6.1.23 – GHSL website - News
6.1.1. Download the population dataset
Open the GHSL JRC web page (Fig. 6.1.1.1) and select the GHS_POP Product (1). Set 2020 in the Epoch field (2), WGS84 as Coord. system (3) and 3 arcsec as Resolution (4). Find the tile (footprint of the image) that covers the area of interest “Vercelli”, the desired tile is highlighted inside the world map (5), and use the zoomed image as the reference (6). Before clicking on the selected tile check the details (7) they need to correspond to the Tile ID: “R5_C19” (8). Click on the footprint with Tile ID: “R5_C19” to start the download.
Note
downloaded data will be in .zip format, unzip the folder.
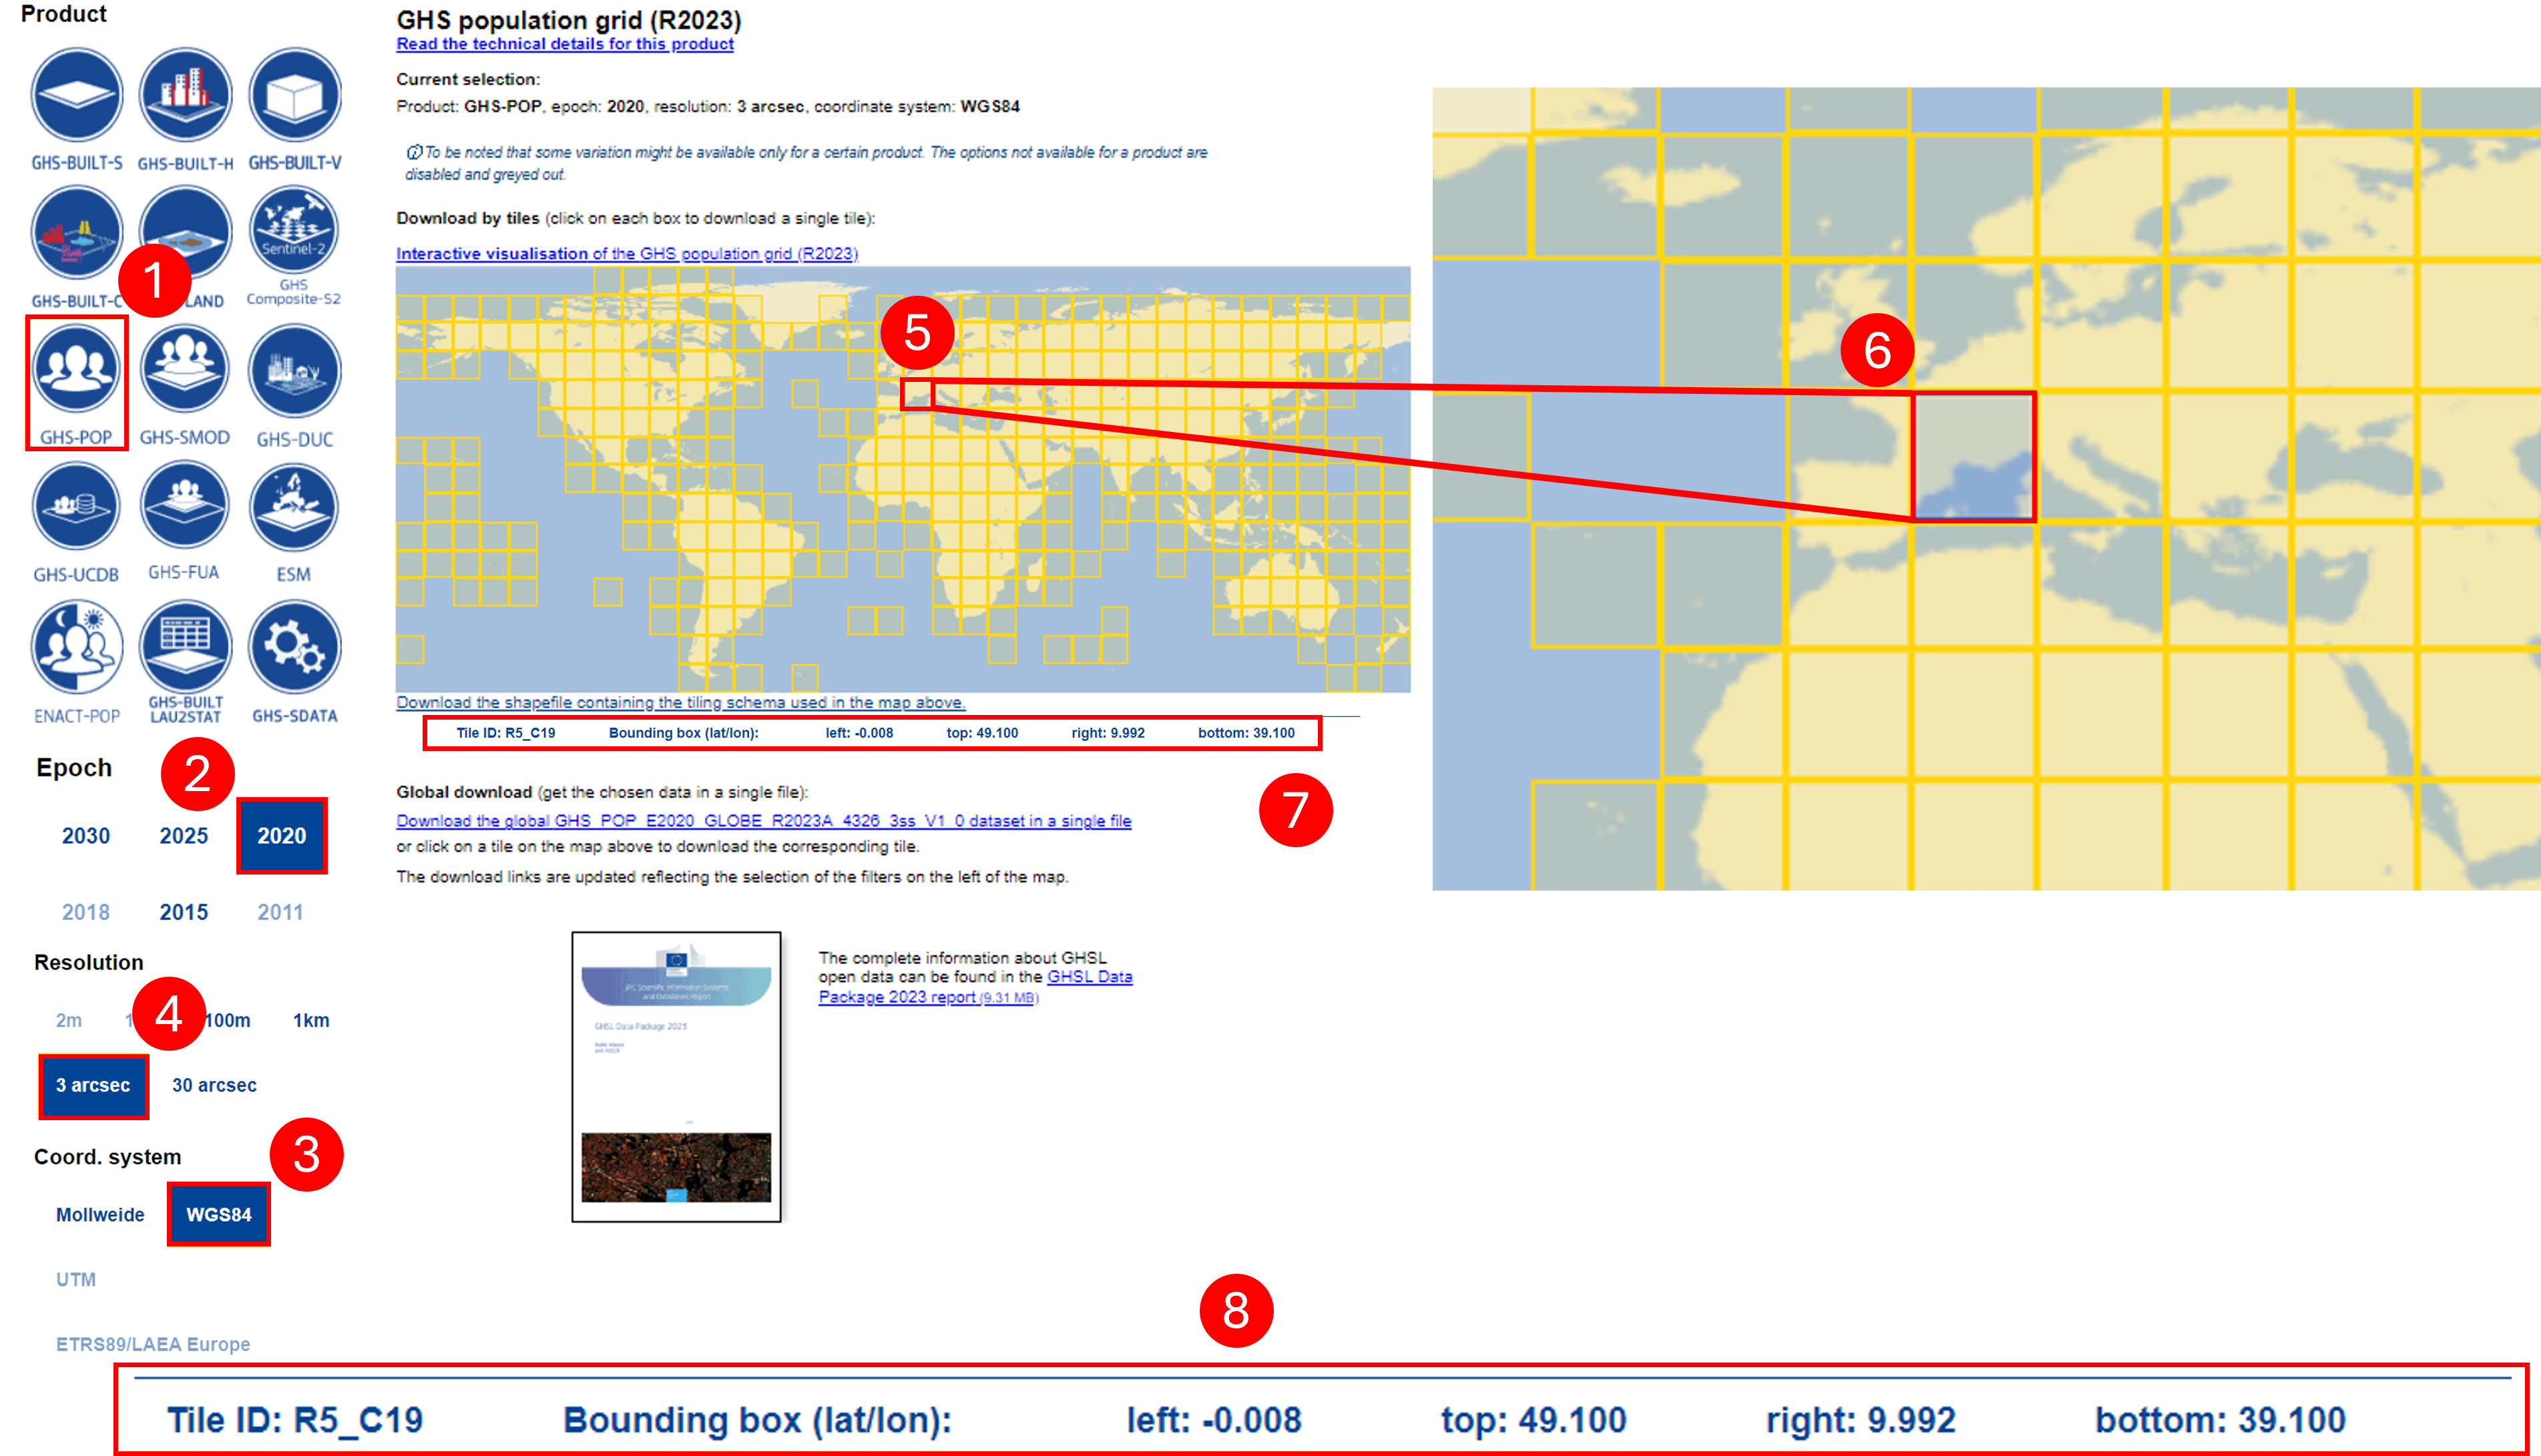
Fig. 6.1.1.1 – Download population data set